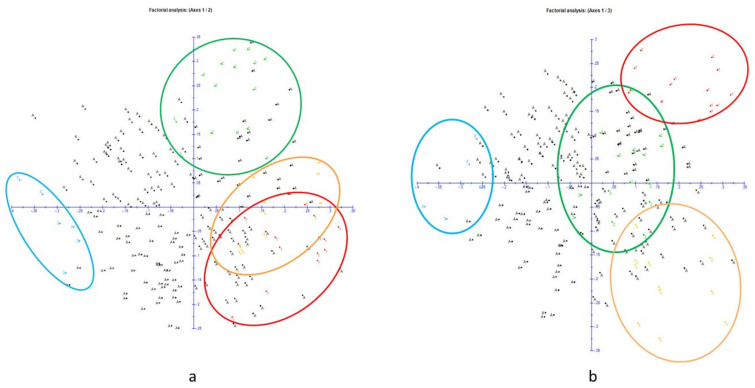
Figure 3.
Principal Coordinates Analysis (PCoA) of the 14 SSR across the 220 sweet cherry accessions. The STRUCTURE groups K1 (red), K2 (green), K3 (blue), K4 (yellow), and A (admixed in black) are shown. First and second components (a) and first and third components (b) of the PCoA analyses are shown. Axes 1, 2, and 3 explained respectively 7.64%, 5.83%, and 4.71% of the variation.

