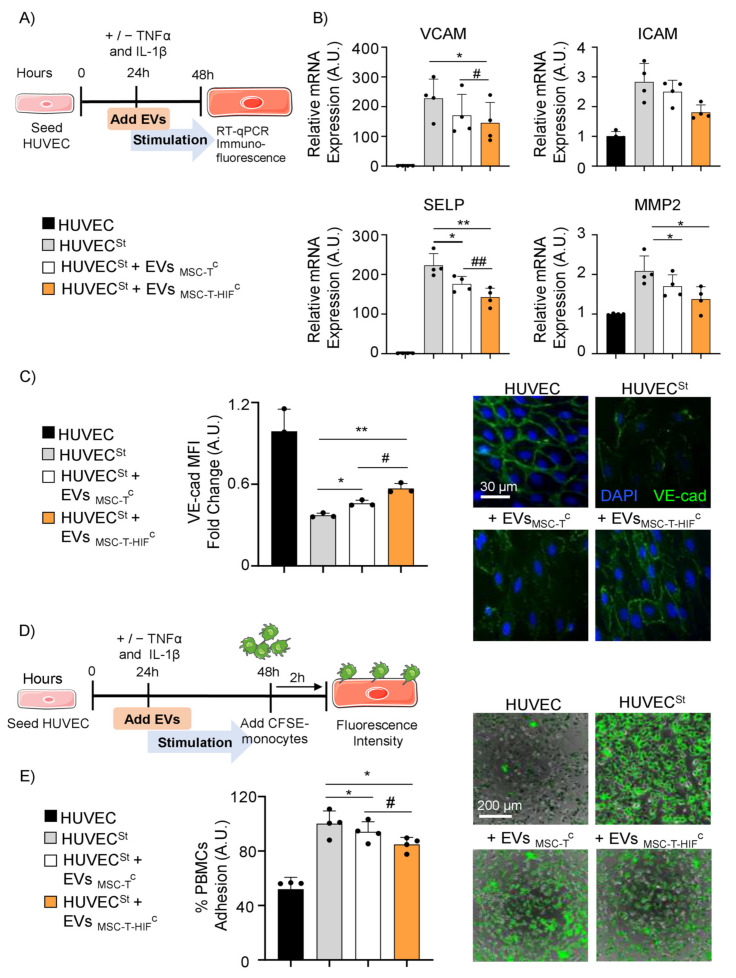
Figure 4.
EVMSC-T-HIFC reduce inflammatory responses and peripheral blood mononuclear cell (PBMC) adhesion to activated endothelium. (A) Scheme of the in vitro experimental design; (B) VCAM, ICAM, SELP and MMP2 expression levels quantified by RT-qPCR in TNF-α- and IL-1β-stimulated HUVEC (HUVECSt). HUVECSt were treated with EVMSC-TC and EVMSC-T-HIFC. Unstimulated HUVECs were used as a control. Expression level of the target gene in each sample was normalized to GAPDH expression. Graphs represent mean ± SD of fold change of four independent experiments. One-way ANOVA with Geisser–Greenhouse correction was used for statistical analysis. (C) Immunofluorescence of VE-cadherin (VE-cad, green) and nuclei staining (blue) to show the distribution of VE-cad in the cell membrane. Scale bar: 30µm. Bar graph shows quantification of mean fluorescence intensity (MFI). Relative MFI was calculated by dividing all individual data by the MFI in unstimulated HUVEC. Graph represents mean ± SD of fold change of three independent experiments. One-way ANOVA with Geisser–Greenhouse correction was used for statistical analysis. (D) Scheme of the in vitro experimental design. (E) Images of PBMCs (green) adhering to unstimulated HUVEC and HUVECSt during 2 h, treated or not treated with EVMSC-TC or EVMSC-T-HIFC. Scale bar: 200 µm. Percentage of PBMC adhesion was calculated considering the stimulated condition as 100% adhesion. Graph represents mean ± SD of fold change of four independent experiments. One-way ANOVA with Geisser–Greenhouse correction was used for statistical analysis. * or # p < 0.05, ** or ## p < 0.01.

