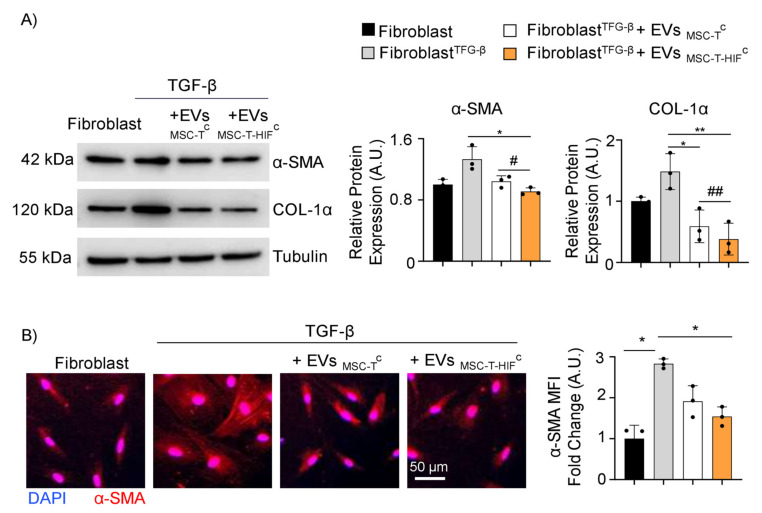
Figure 5.
EVMSC-T-HIFC ameliorate fibrosis induced by TGF-β. (A) Representative Western blots of α-SMA and COL-1α in unstimulated and TFG-β-stimulated dermal fibroblasts treated with EVMSC-TC or EVMSC-T-HIFC. Expression levels were quantified by densitometry relative to the levels in unstimulated fibroblasts. Tubulin was used as a loading control. Graphs represent the mean ± SD of three independent experiments. One-way ANOVA with Geisser–Greenhouse correction was used for statistical analysis. (B) Immunofluorescence of α-SMA (red) and nuclei staining (blue). Scale bar: 50 µm. Bar graph shows quantification of red mean fluorescence intensity (MFI). Relative MFI was calculated by dividing all individual data by the MFI in unstimulated fibroblasts. Graph represents the mean ± SD of three independent experiments. One-way ANOVA with Geisser–Greenhouse correction was used for statistical analysis. * or # p < 0.05, ** or ## p < 0.01.

