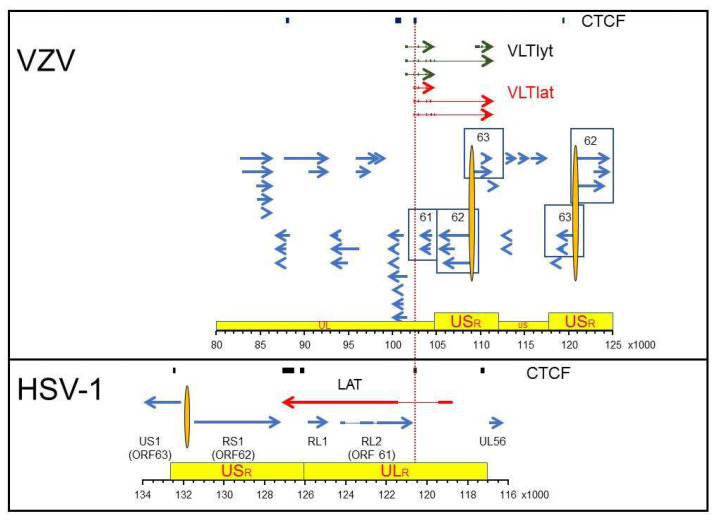
Figure 1.
Latency associated transcription regions of VZV and HSV-1. The regions of VZV (top panel) and HSV-1 (bottom panel) that span predicted (VZV) or discovered (HSV-1) CTCF-binding sites are shown relative to the most current VZV transcription annotation (Braspenning et al. 2020) and the annotated HSV-1 reference sequence (NCBI Reference Sequence: NC_001806.2). The genomes are presented with the latency associated transcripts on the top strand in 5’ to 3’ orientation. Arrows show the relative size and direction of each transcript with exons (thick arrows/lines) and introns (thin lines). The red colored latency associated transcripts are distinguished from the blue lytic gene transcripts with the VZV Varicella Latency Transcripts associated with initial stage of virus reactivation colored green (VLTlyt). Specific genes mentioned in the text are identified by number (VZV) or name (HSV-1) with variants of associated genes contained within boxes. The topological architecture of each genome is shown in yellow boxes with the unique long (UL), unique short (US) and associated repeat regions (ULR, USR) highlighted. The nucleotide position of the selected DNA regions is listed for each virus in the ruler at the bottom of each box.

