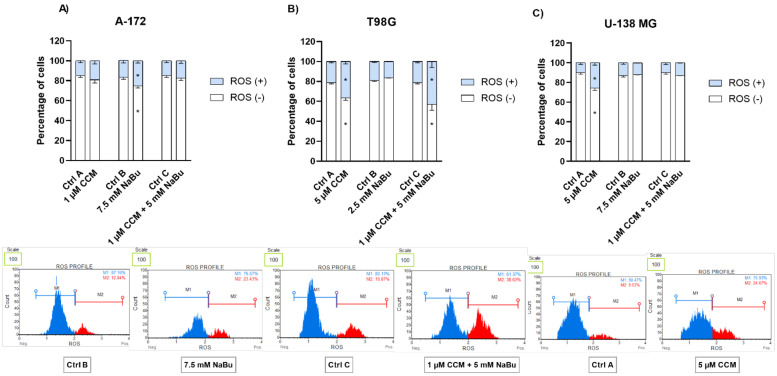
Figure 6.
Impact of CCM and NaBu, and their combination on ROS (superoxide) generation in A-172 (A), T98G (B), and U-138 MG (C) cell lines after 48 h of treatment. Percentage of ROS positive (ROS (+)) and negative (ROS (−)) was detected by flow cytometric analysis after staining with dihydroethidium. Cells treated with vehicle (DMSO, PBS or both) are designated as Ctrl A, Ctrl B, and Ctrl C, respectively. Exemplary histograms are presented below diagrams (Ctrl B and 7.5 mM NaBu refer to A-172 cell line, Ctrl C and combination treatment of 1 µM and 5 mM NaBu refer to T98G cell line, and Ctrl A and 5 µM CCM refer to U-138 MG cell line). Values are shown as mean ± SEM calculated from three independent experiments. (*) indicates statistically significant differences from control group, p < 0.05.

