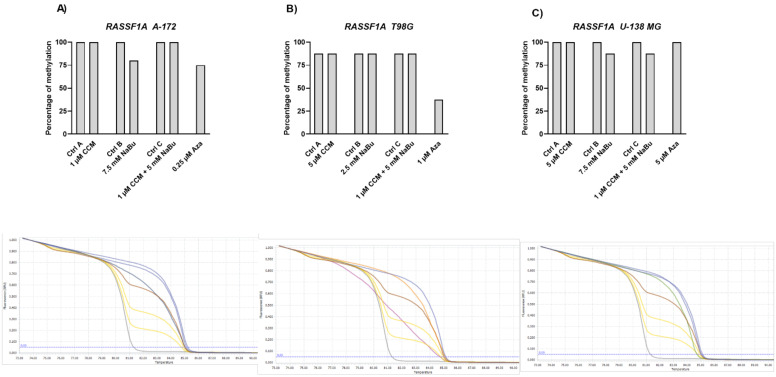
Figure 11.
Results of MS-HRM analysis with representative melting curves of RASSF1A promoter methylation in A-172 (A), T98G (B), and U-138 MG (C) cell lines. Cells treated with vehicle (DMSO, PBS or both) are designated as Ctrl A, Ctrl B, and Ctrl C, respectively. Due to semiquantitative nature of generated results, no SEM bars are shown. Below each bar chart melting curves of control and best demethylating compound/combination are presented, together with subsequent controls: 100%, 75%, 50%, 25%, and 0% methylated controls (blue, brown, upper yellow, lower yellow, grey, respectively). For A-172 cell line, melting curve generated after treatment with 5-Aza is presented (dark blue, close to brown, 50% methylated control) regarding Ctrl A (blue line, close to 100% methylated control). For T98G cell line, also Aza is presented (pink) regarding Ctrl A (orange). In case of U-138 MG cell line, 7.5 mM NaBu is presented (green) in relation to Ctrl B (blue line, close to 100% methylated control).

