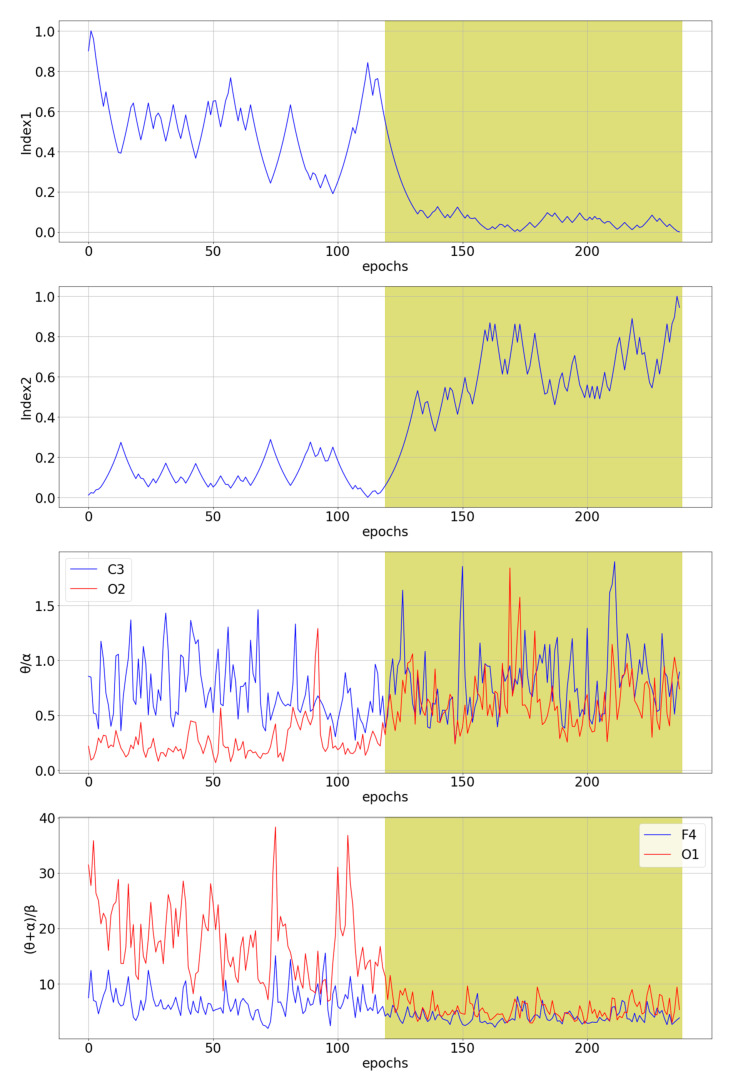
Figure 4.
The comparison of the two novel multichannel indices with the best and the worst channel for θ/α and (θ + α)/β single-channel indices for subject tr08-0111. The white part of the diagram represents an awake state, while the yellow part of the diagram represents stage 1 of sleep, i.e., a drowsiness state.

