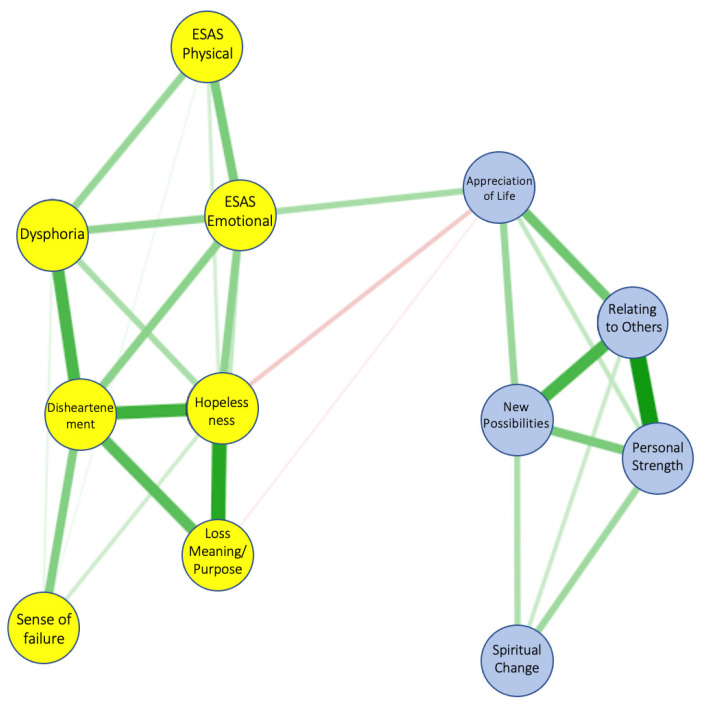
Figure 1.
The network represents the relationships of PTGI factors with ESAS symptoms and DS-IT dimensions. Lines between symptoms (edges) are colored in green when they represent positive correlations and in red when they represent negative correlations. The magnitude of color represents the degree of the relationship between symptoms. ESAS: Edmonton Symptom Assessment System; ESAS-PHYS: physical distress sub-score; ESAS-Emotional: psychological distress sub-score.

