Figure 3.
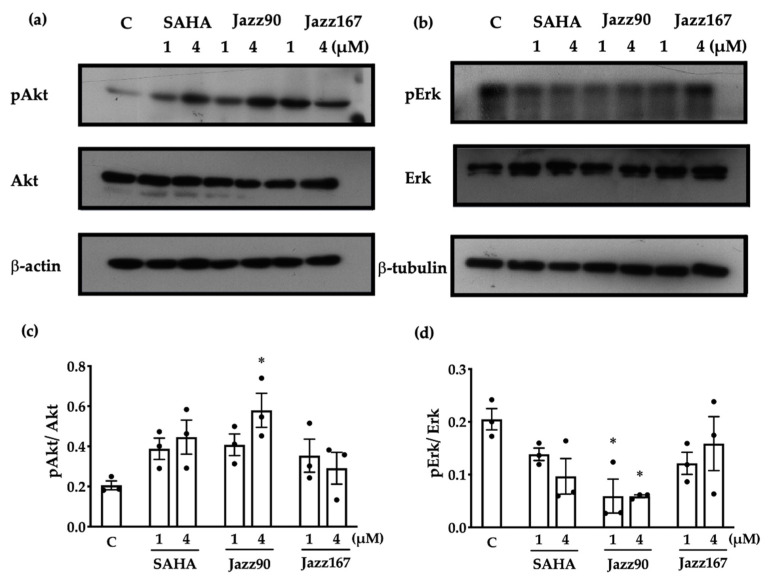
Compound-mediated changes in pAkt/Akt and pErk/Erk in PC3 cells. PC3 cells were treated with SAHA, Jazz90 and Jazz167 at 1 and 4 µM. Vehicle control cells (C) were treated with 0.5% DMSO. Cells were harvested 24 h after treatment. Representative Western blots for (a) pAkt, Akt and β-actin (loading control) and (b) pErk, Erk and β-tubulin (loading control). Densitometry of scanned Western blots for (c) pAkt and (d) pErk is shown. Bars represent the mean ± S.E.M. from 3 independent experiments, as shown by the data points. Data were analysed using a two-way ANOVA followed by a Bonferroni’s post-hoc test. *significantly different relative to the control, p < 0.05.

