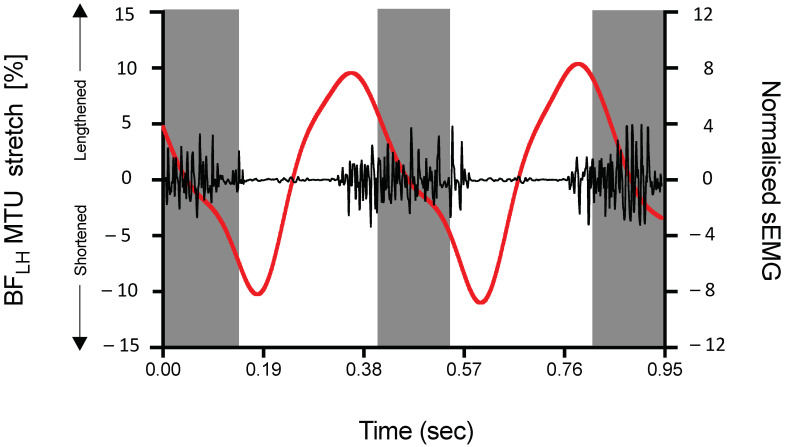
Figure 1.
BFLH MTU stretch and biceps femoris (BF) surface electromyographic (sEMG) activity during maximal sprinting. Experimental data obtained from Schache et al. [25]. The black line represents BF sEMG activity (high-pass filtered at 20 Hz). BF sEMG was normalised to the linear envelope ‘grand’ mean (i.e., the mean of all the valid periods of sEMG activity over the stride cycle). The red line represents the change in BFLH MTU stretch which was calculated as a percentage of the MTU length assumed during a neutral upright stance pose. All data are recorded simultaneously from the same participant for two consecutive stride cycles during sprinting at a speed of 9.7 m/s. Stance phase is indicated by a vertical grey shaded bar.

