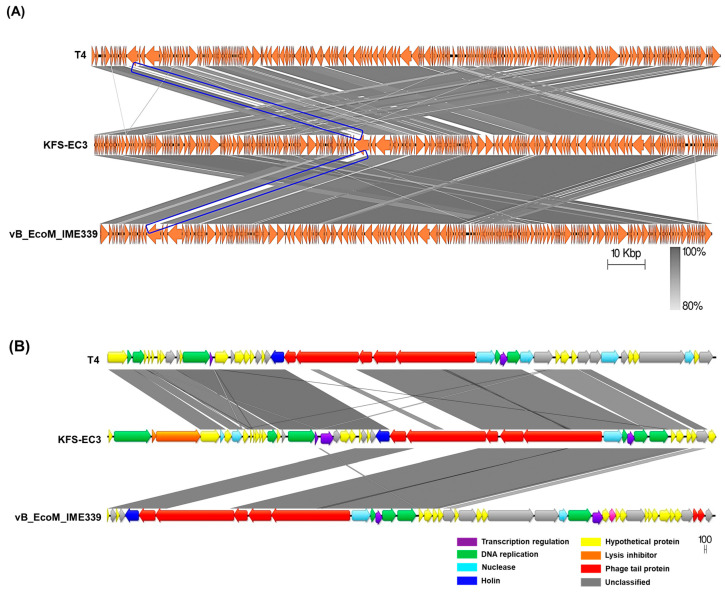
Figure 8.
Genomic comparative analysis of KFS-EC3 (middle), Escherichia phage T4 (top), and E. coli phage vB_EcoM_IME339 (bottom). Gene clusters whose translated products shared low similarity were indicated using blue boxes. (A) Complete genome of the three phages visualized using Easyfig. (B) Boxed gene clusters at high magnification. Homologous regions were indicated by gray shading in figures.

