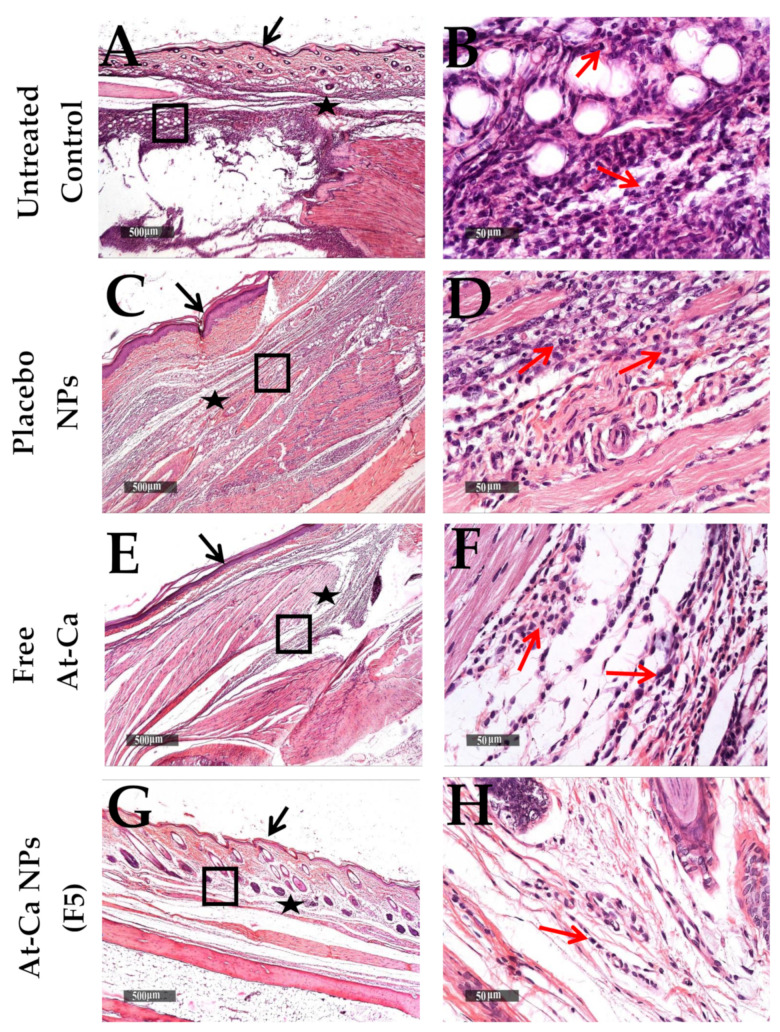
Figure 12.
Histological changes of Paws skin layers in different groups (n = 6 per group), at 72 h time intervals after carrageenan injection. (A,B): untreated control, (C,D): Placebo NPs, (E,F): Free AT-Ca and (G,H): AT-Ca NPs (F5). H and E stain. (A,C,E,G) micrographs at ×40. Highlighted boxes (B,D,F,H) micrographs at ×400. Black arrows and stars show the epidermal layer and subcutaneous tissue, respectively. Red arrows show inflammatory cells infiltrates.

