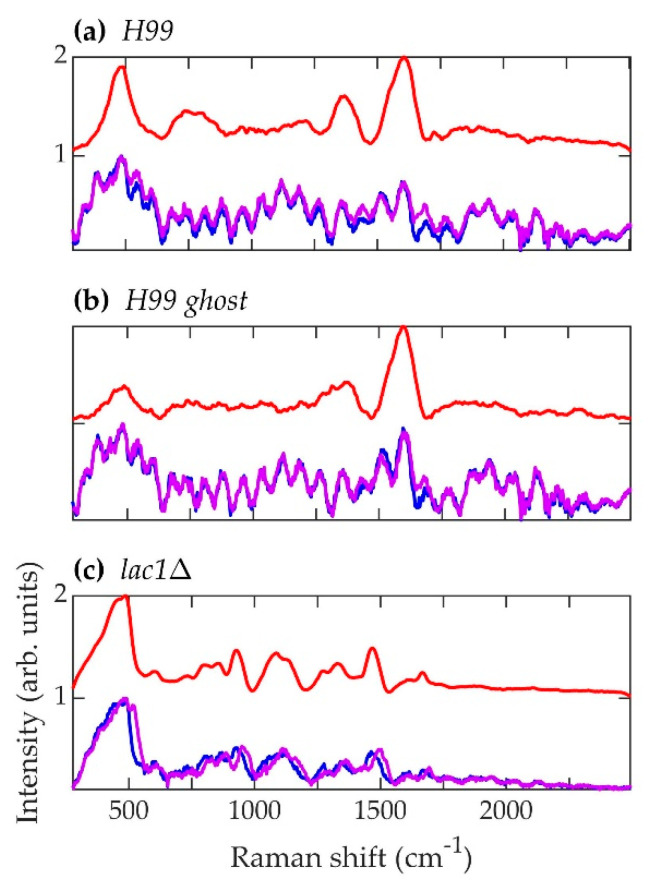
Figure 7.
Spectra corresponding to C. neoformans strains (a) H99, (b) H99 ghost, and (c) lac1Δ. Blue (~784.1 nm laser excitation) and purple (~785.8 nm laser excitation) curves are the average normalized background-subtracted raw spectra, while the red curves are average retrieved pure Raman spectra.

