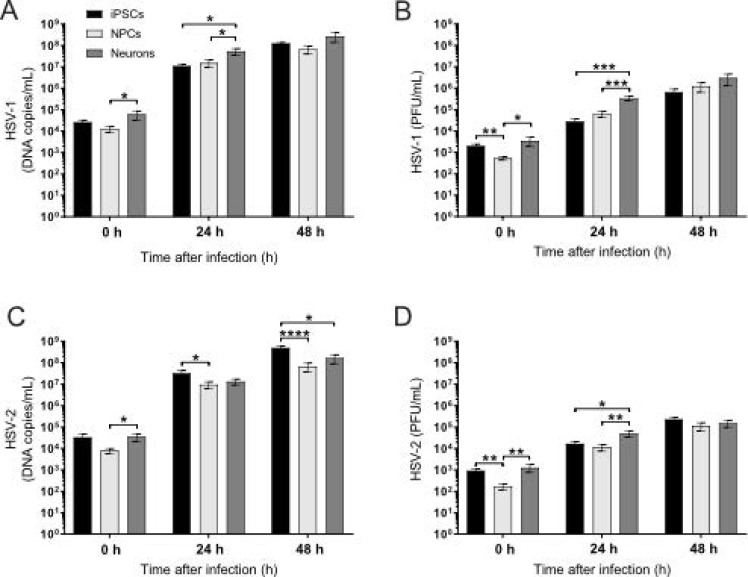
Figure 5.
Viral DNA and PFU in iPSCs, NPCs and neurons, viral DNA copies/mL measured with qPCR and the amount of infectious virus measured as plaque-forming units (PFU/mL) 0, 24 or 48 hours post-inoculation with HSV-1 or HSV-2 at MOI = 0.1 (A–D). When measured directly after the medium change following infection, HSV-1 DNA copies/mL ((A), 0 h) is significantly lower in NPCs than in neurons, and HSV-1 PFU/mL ((B), 0 h) is significantly lower in NPCs than in both neurons and iPSCs. Twenty-four hours post-inoculation, HSV-1 DNA copies/mL ((A), 24 h) and HSV-1 PFU/mL ((B), 24 h) were significantly higher in neurons than in both iPSCs and NPCs. Forty-eight hours post-inoculation, no differences in HSV-1 DNA copies/mL ((A), 48 h) or HSV-1 PFU/mL ((B), 48 h) were observed between the three differentiation stages. At 0 h post-inoculation, HSV-2 DNA copies/mL (C) was significantly lower in NPCs than in neurons, and HSV-2 PFU/mL (D) was significantly lower in NPCs than in both neurons and iPSCs. Twenty-four hours post-inoculation, HSV-2 DNA copies/mL (C) was significantly higher in iPSCs than in NPCs, while HSV-2 PFU/mL was significantly higher in neurons than in both iPSCs and NPCs. Forty-eight hours post-inoculation, HSV-2 DNA (C, 48 h) was significantly higher in iPSCs than in NPCs and neurons, while no differences in HSV-2 PFU/mL (D) were observed between the three differentiation stages. iPSCs and NPCs; bars represent mean of six separate differentiations from two iPSC lines +/− SEM. Neurons; bars represent mean of four separate experiments from two iPSC lines +/− SEM. * p < 0.05, ** p < 0.01, *** p < 0.001 and **** p < 0.0001 from Student’s t-test.

