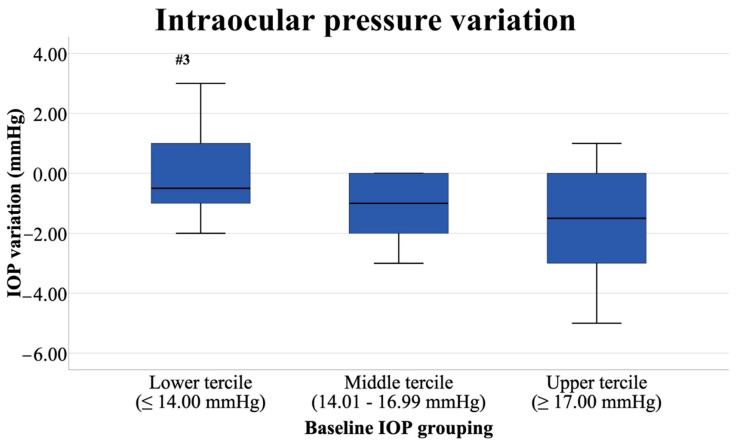
Figure 1.
Intraocular pressure variation (post-exercise IOP minus pre-exercise IOP) of each of the three groups formed considering the baseline IOP levels (lower: n = 18; middle: n = 17; upper: n = 14). Values of the vertical axis (IOP variation) are presented in mmHg. The symbol “#3” highlights significant differences with the Upper-Tercile Group (p = 0.008, dunb = 0.96).

