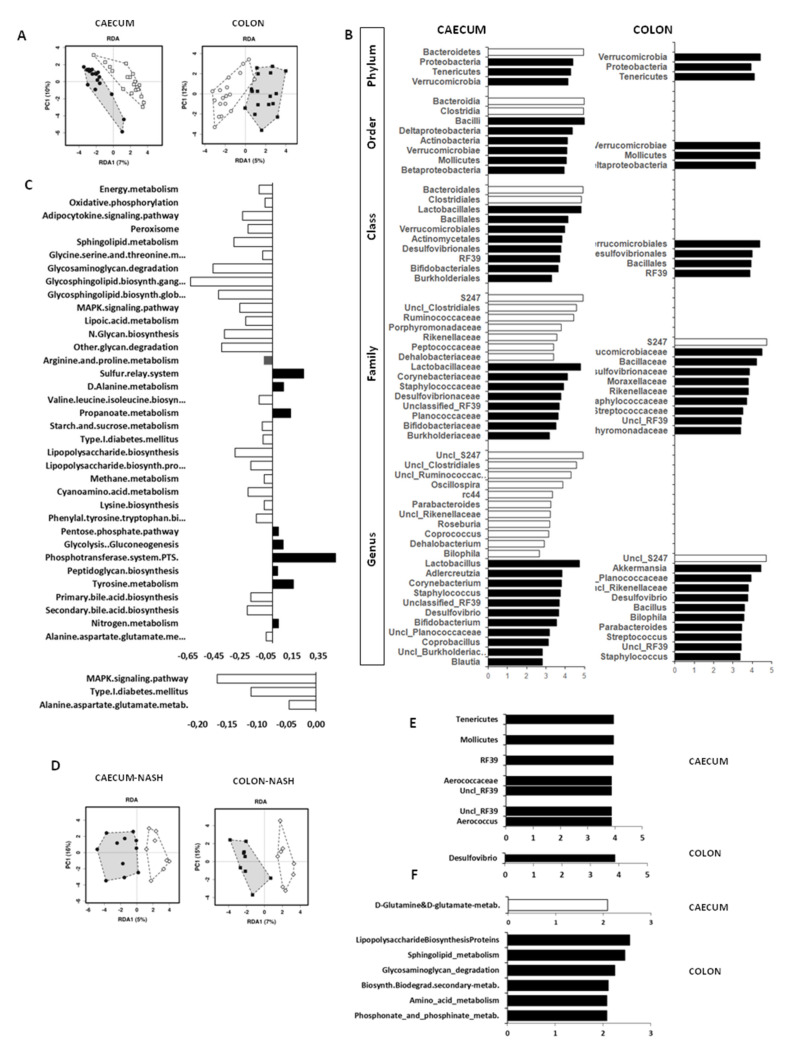
Figure 2.
Significant differences in caecum and colon microbiota composition between weaning (white circles) and adult mice (black dots) are shown in RDA analysis (A), whereas LDA/LEFSe analyses (B) identify unique bacteria taxa biomarkers of weaning mice (white bars) and adult mice (black bars). Significant differences in metabolic pathways from KEGG analysis are expressed as ratios in panel (C), in which negative white bars indicate pathways prevailing at weaning, and positive black bars refer to pathways prevailing in adults. Panel (D) shows RDA analysis in animals stratified by the presence (black) or absence of NASH (white), and the corresponding significant unique biomarkers are given in panel (E) (bacteria taxa) and (F) (metabolic pathways).

