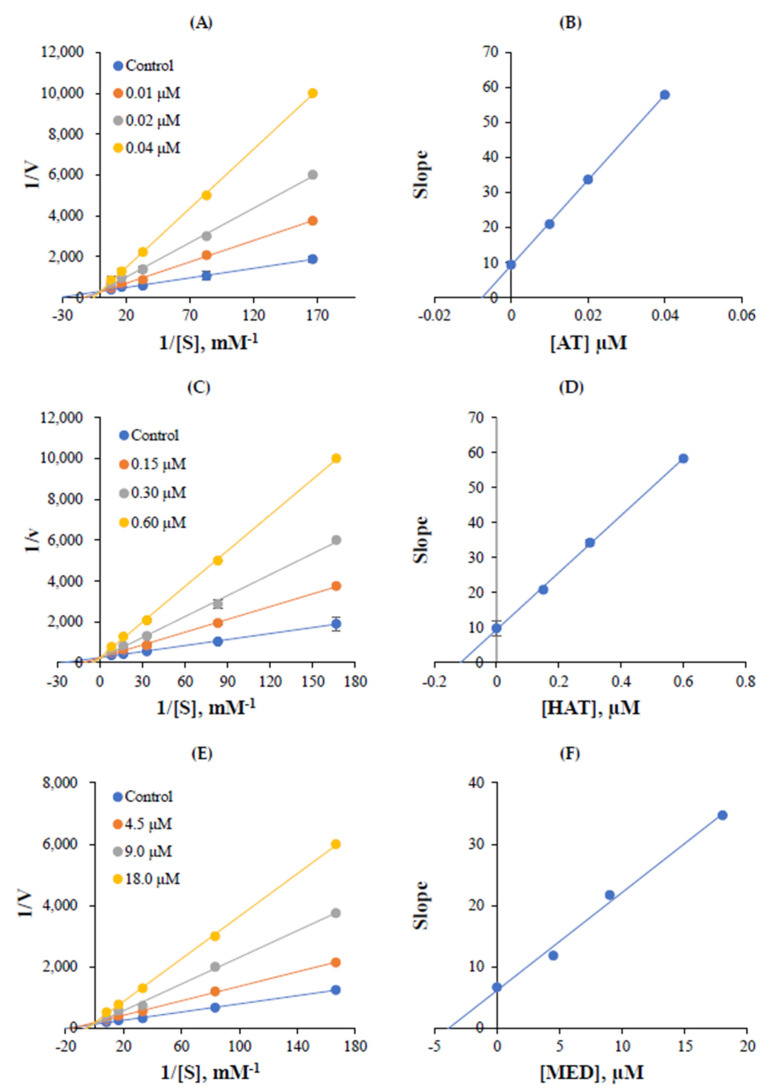
Figure 3.
Lineweaver–Burk plots (A,C,E) for hMAO-A inhibition by AT, HAT, and MED, and their secondary plots (B,D,F) using their slopes following inhibitor concentrations. Five different substrate concentrations (0.006, 0.012, 0.03, 0.06, and 0.12 µM) were used, and inhibitors were added to make three concentrations, i.e., ~1/2 × IC50, ~IC50, and ~2 × IC50. Triplicate experiments determined error bars.

