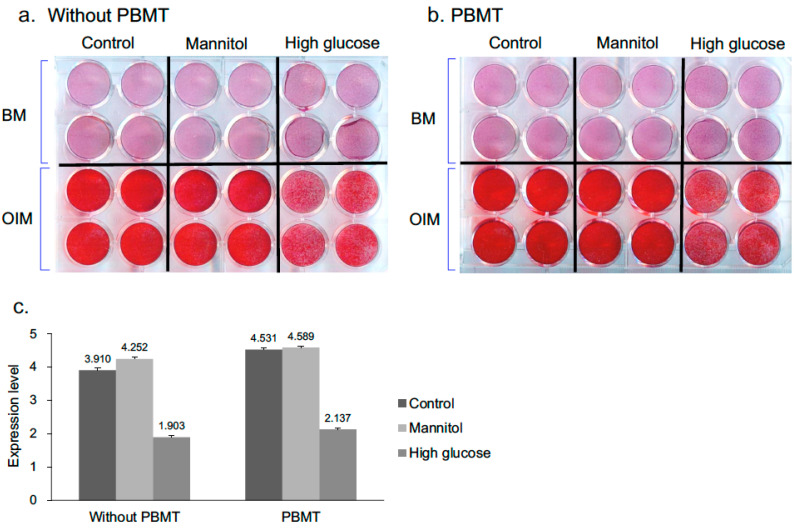
Figure 1.
Analysis of the mineral deposition in D1 cells on day 7 by Alizarin Red S staining. (a,b) Representative photographs from Alizarin Red S staining assays. D1 cells were cultured in BM or OIM with low or high glucose content for 7 days. PBMT treatment (8 J/cm2) was applied daily directly onto cells. Cells were stained with Alizarin Red S for mineralization analysis. (c) Quantitative data obtained from destained Alizarin red S absorbance. The results are expressed as means ± SD of three replicates.

