Figure 2.
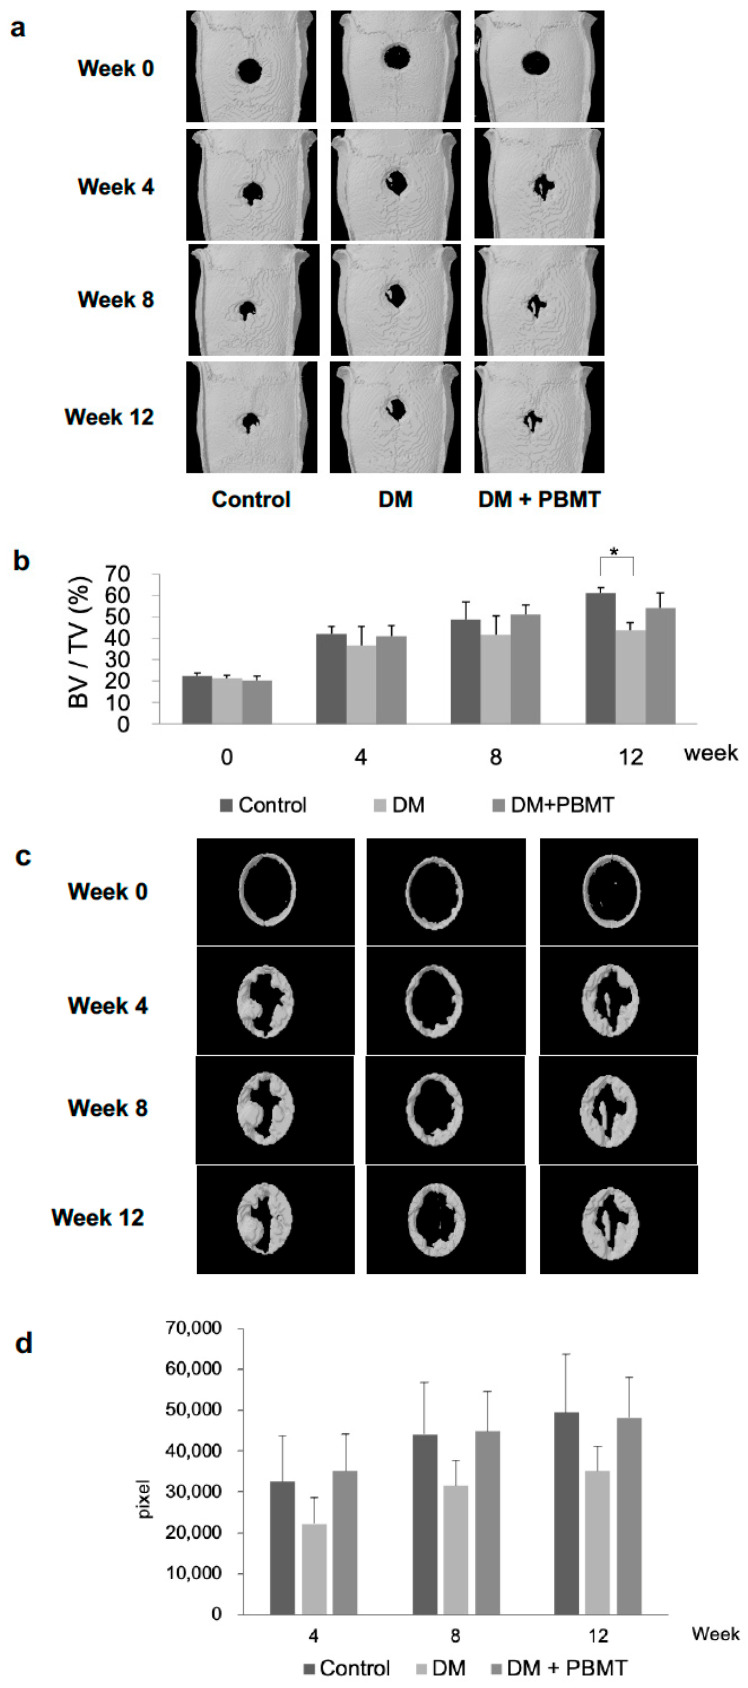
MicroCT analysis of in vivo calvarial bone repair at week 12 post-operation. (a) Representative microCT images of calvarial bone sections from each group: Control, DM, and DM + PBMT treatment. Calvarial bone defects (3 mm) were generated in adult Wistar rats and PBMT treatment (4 J/cm2) was applied daily. The follow-up imaging and analyses were performed at Weeks 0, 4, 8, 12 postoperatively to quantify residual defect volume and new bone formation. (b) Quantitative measurements obtained from microCT images. The data illustrated as the percentage of bone volume (BV) per total volume (TV) of the calvarial defect and expressed as means ± SD, * p < 0.05. (c) Representative microCT images of calvarial bone matrix formation at Weeks 0, 4, 8 and 12 from each group: Control, DM, and DM + PBMT treatment. Calvarial bone defects (3 mm) were generated in adult Wistar rats and PBMT treatment (4 J/cm2) were applied daily. The close-up imaging on the calvarial defect sites were performed to evaluate new bone matrix formation at Weeks 0, 4, 8, 12 postoperatively. (d) Quantitative measurements obtained from microCT images of the calvarial bone matrix formation at Weeks 0, 4, 8 and 12. The data is illustrated as the density measurements from the pixel mapping of the region of interest (ROI) and expressed as means ± SD.

