Figure 3.
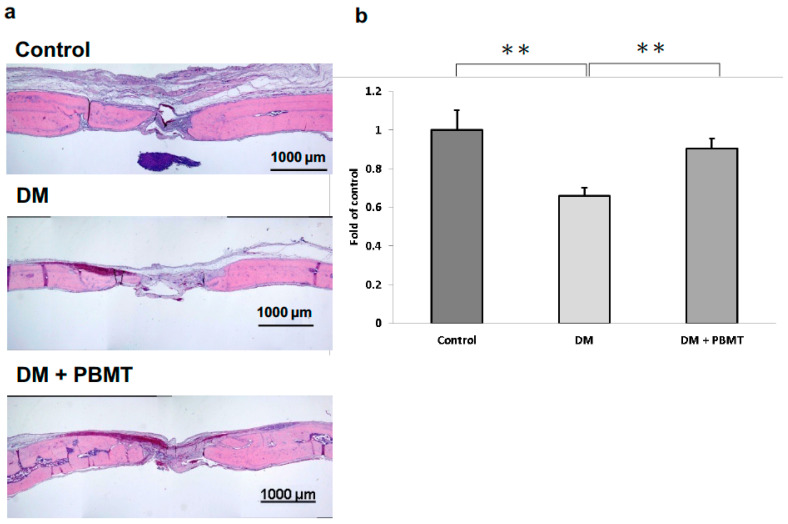
H&E staining of the cross section of the calvarial defects at Week 12 post-operation. (a) Representative H&E staining images of calvarial bone sections from each group: Control, DM, and DM + PBMT treatment. Calvarial bone defects (3 mm) were generated in adult Wistar rats. PBMT treatment (4 J/cm2) were applied daily. The calvarial bone sections were collected at Week 12 postoperatively and stained using H&E. Scale bar, 1000 μm. (b) Quantitative measurements obtained from H&E-stained images. The new bone formation area in the calvarial defect site was measured and the percentage of bone matrix within the callus was calculated. Data were expressed as means ± SD, ** p < 0.001.

