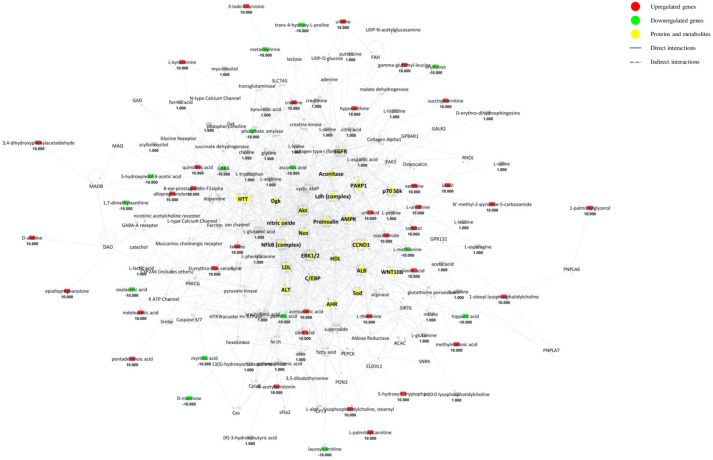
Figure 2.
Merged networks based on inter-metabolite connections from the total matrix. Red and green shapes indicate genes significantly increased or decreased in expression in MS patients, whereas the number below represents the fold change log. The relationship between genes may lead to direct (solid lines) or indirect interaction (dashed lines). Yellow shapes indicate proteins and metabolites from the total matrix.

