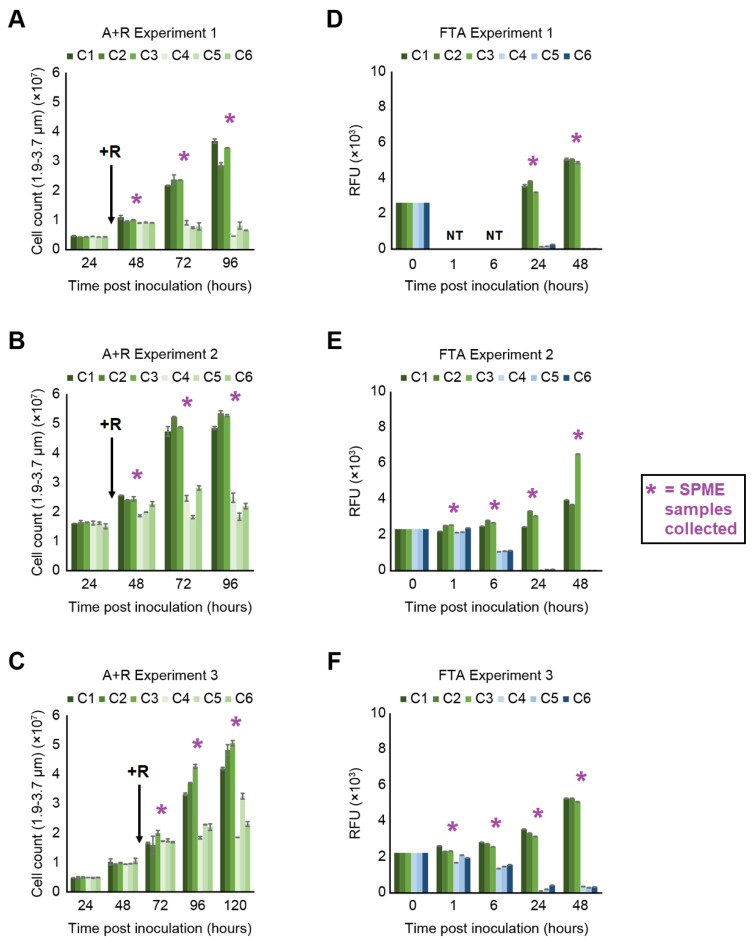
Figure 1.
(A–C) Algae concentrations as determined by direct enumeration for three healthy algae cultures (C1–C3) and three rotifer grazing algae cultures (C4–C6) for the three A + R experiments. Rotifer addition marked by “+R” with an arrow at the relevant point in time. (D–F) Fluorescence measurements for three healthy algae cultures (C1–C3) and three freeze–thawed algae cultures (C4–C6) for the three Freeze–Thaw Algae (FTA) experiments. The error bars represent standard deviation calculated from technical replicates for each sample (n = 2). The starting concentrations of the FTA experiments were equivalent at the time of algal inoculation (t = 0 h), and thus the standard deviation for these measurements is zero. No timepoints for1 h and 6 h in FTA Experiment 1 were taken, as denoted by “NT”. SPME samples were collected at timepoints in experiments marked by an asterisk (*).

