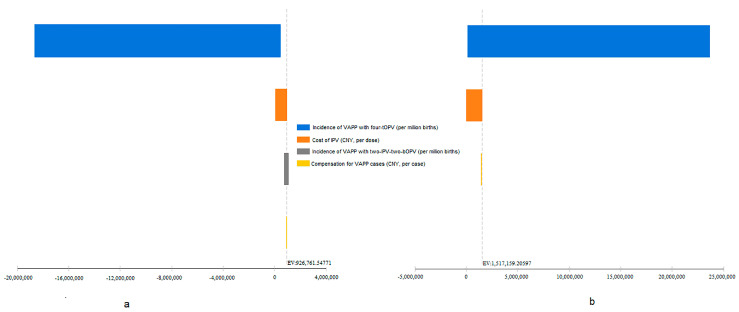
Figure 3.
Tornado plot of the two-IPV-two-bOPV (a) and the four-IPV (b) immunization schedules, compared to the four-tOPV schedule, using univariate sensitivity analysis. The X-axis represented ICERLY. The incidence of VAPP cases with the four-tOPV schedule, incidence of VAPP cases with the two-IPV-two-bOPV schedule, compensation cost of VAPP cases, and cost of IPV were included in the analysis according to the range of values (Table 1). Positive and negative associations were further determined by the estimation of ICER, which were not presented in the figure. bOPV, bivalent live attenuated oral polio vaccine; tOPV, trivalent live attenuated oral polio vaccine; ICER, incremental cost-effectiveness ratio; IPV, inactivated polio vaccine; LY, life year; VAPP, vaccine-associated paralytic poliomyelitis.

