Figure 3.
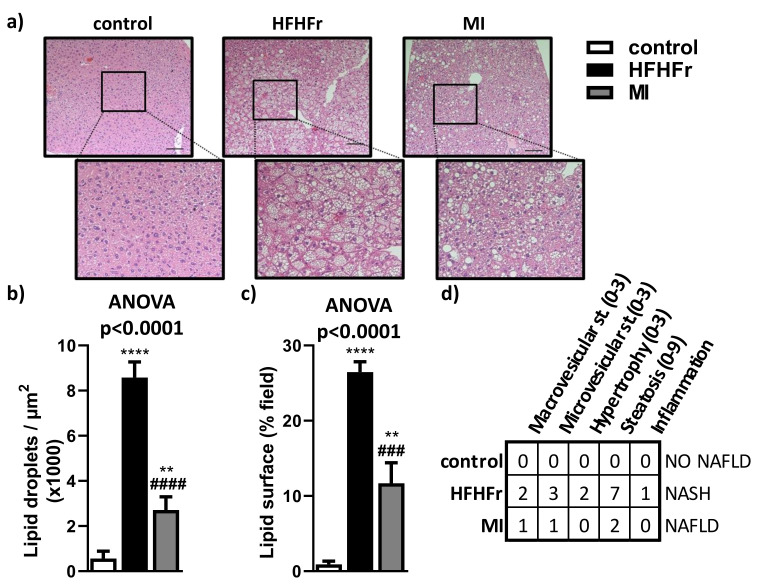
Liver histopathology and image analysis were determined by (a) H&E (hematoxylin-eosin staining) and an amplification of the selected area showing a magnified area in the lower panel; (b) lipid droplets count; (c) lipid droplet surface field; and (d) NAFLD/NASH scoring table. st., steatosis. Bar = 100 µm. Data are mean ± SEM; n = 6 animals/group. ** p < 0.01, **** p < 0.0001 vs. control mice; ### p < 0.001; #### p < 0.0001 vs. HFHFr mice.

