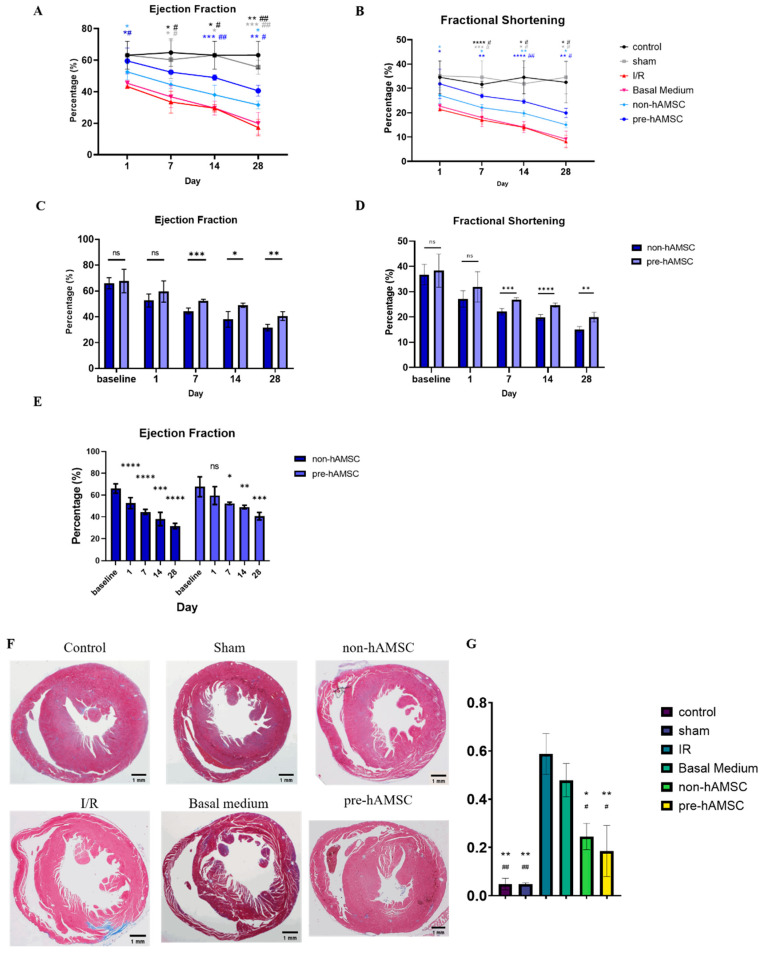
Figure 6.
Cardiac function and fibrosis in each group during the 4-week period after the I/R injury. LVEFs (A) and FS (B) of control, sham, I/R, basal medium, non-hAMSC, and pre-hAMSC groups. (C–E) Representative bar graphs of left ventricular function in non-hAMSC and pre-hAMSC groups. (F) Masson’s Trichrome staining of histological transverse sections of hearts in each group 28 days after the I/R injury (Bar = 1 mm). (G) Quantification of heart fibrosis area in each group at 28 days after I/R surgery via Masson’s Trichrome staining. * Comparison with I/R group. * p < 0.05, ** p < 0.01, *** p < 0.001, **** p < 0.0001. # Comparison with Basal Medium group. # p < 0.05, ## p < 0.01.

