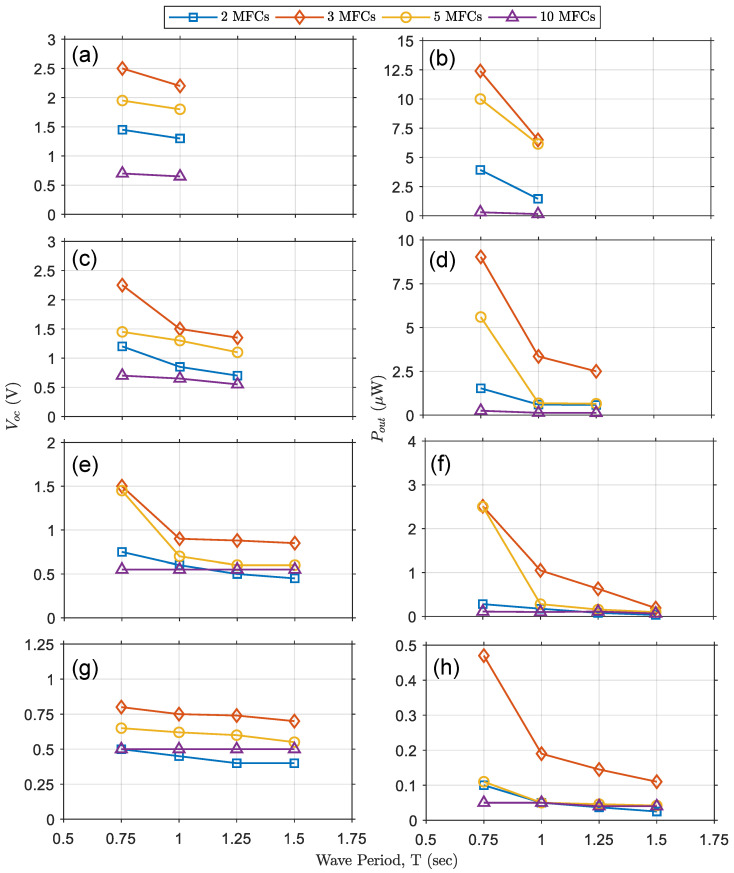
Figure 8.
Graphs depicting VOC and POUT as functions of wave period for a specific wave height and for OWECs with varying numbers of MFCs (2, 3, 5, and 10). (a,b) Output voltage and power for 20 cm nominal wave height and 0.75 and 1.00 s wave periods. (c,d) Output voltage and power for 15 cm nominal wave height and 0.75, 1.00, and 1.25 s wave periods. (e,f) Output voltage and power for 10 cm nominal wave height and 0.75, 1.00, 1.25 and 1.50 s wave periods. (g,h) Output voltage and power for 5 cm nominal wave height and 0.75, 1.00, 1.25 and 1.50 s wave periods.

