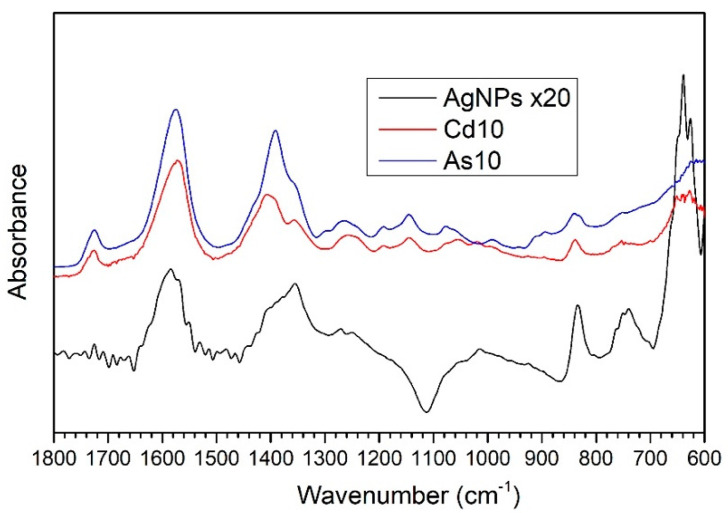
Figure 5.
FTIR spectra in the 1800-600 cm−1 range of samples As10 and Cd10, treated with 10 ppm solutions of As (III) and Cd (II) ions, respectively, and for the untreated reference sample, AgNPs. The AgNPs reference spectrum was multiplied ×20 in order to obtain a similar intensity for the three spectra.

