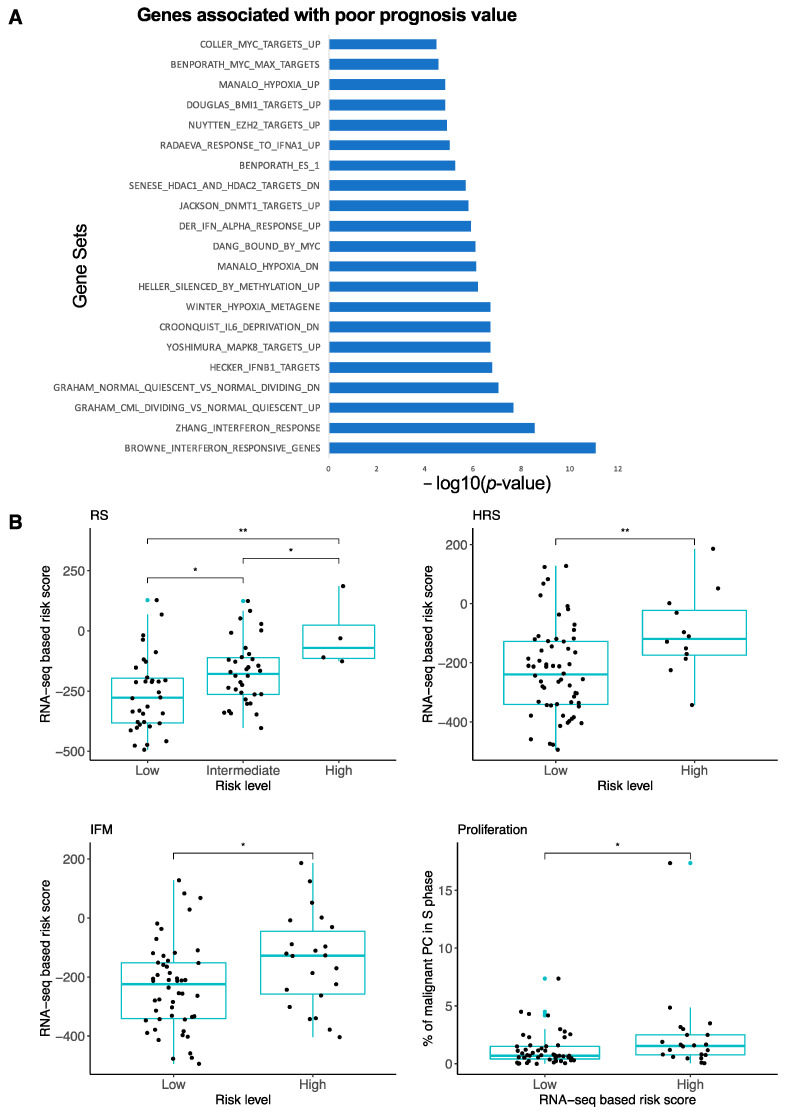
Figure 2.
Characterization of RNA-seq-based risk score. (A) Gene set enrichment analysis of RNA-seq-based risk score genes associated with poor prognosis. DN: downregulated; UP: upregulated. A complete description of all of the molecular signatures presented is available in the GSEA molecular signatures database (https://www.gsea-msigdb.org/gsea/msigdb/index.jsp) (28 September 2021). (B) Comparison of RNA-seq-based risk score with Affymetrix GEP-based risk scores (RS, HRS, IFM) and proliferation. Wilcoxon test. ns: nonsignificant, * p-value < 0.05, ** p-value < 0.01.

