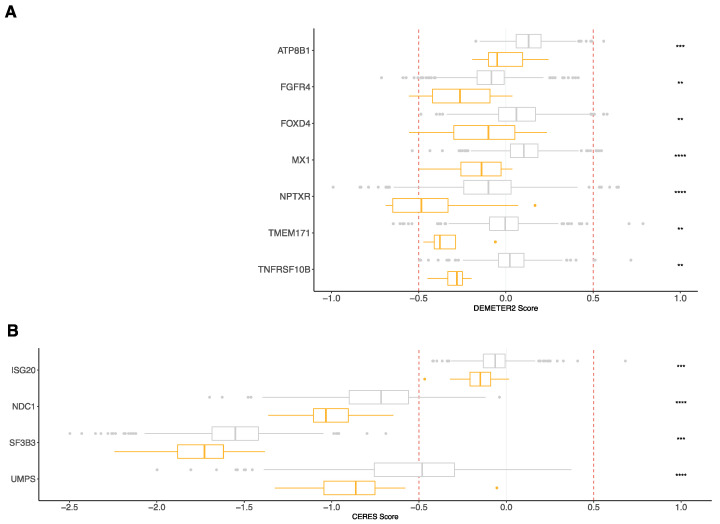
Figure 4.
RNA-seq-based risk score revealed genes associated with MM pathophysiology. Boxplots of dependency scores calculated from the Cancer Dependency Map project (https://depmap.org) (28 September 2021). (A) RNAi-based viability assays in MM cell lines (n = 16) and other cancer cell lines (n = 695). (B) CRISPR/Cas9-based viability assays in MM cell lines (n = 20) and other cancer cell lines (n = 769). DEMETER2 and CERES scores were calculated from RNAi-based and CRISPR–Cas9 viability screens, respectively. A lower score means that a gene is more likely to be dependent in a given cell line. A score of 0 is equivalent to a gene that is not essential, whereas a score of -1 corresponds to the median of all common essential genes. Boxplots in orange represent multiple myeloma cell lines, and boxplots in grey correspond to other cancer cell lines. ** p-value < 0.01, *** p-value < 0.001, **** p-value < 0.0001.

