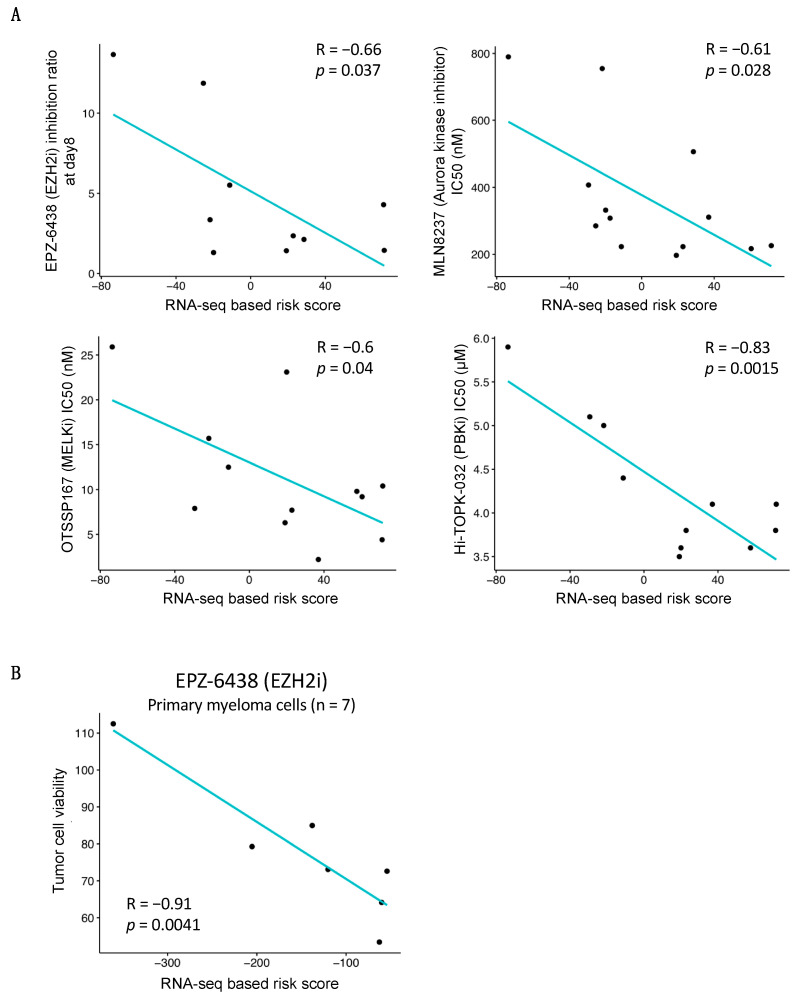
Figure 5.
Correlation between RNA-seq-based risk score and response to targeted inhibitors. (A) Linear regression analysis of the inhibition ratio (treatment/control) of EPZ-6438, an EZH2 inhibitor, or the IC50 of three inhibitors of oncogene kinases (Aurora kinase inhibitor, MELKi, PBKi) in a function of the RNA-seq-based risk score in HMCLs. (B) RNA risk score predictions for EPZ-6438 sensitivity of primary patient myeloma cells. R represents the Pearson correlation coefficient (Pearson correlation test).

