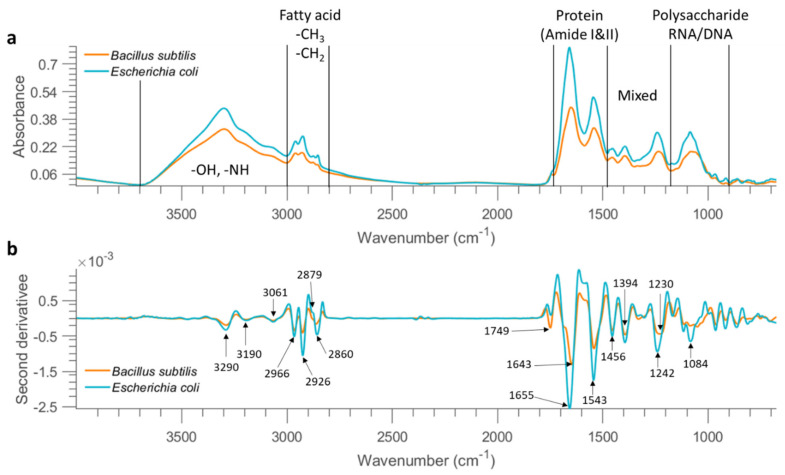
Figure 1.
Mean FTIR spectra (after applying asymmetric least squares smoothing to remove baseline) of all bacterial cells from the concentration of 10 OD deposited on stainless steel (a) and the result after performing second derivative (b). The characteristic peaks are pointed out in the derivative spectra.

