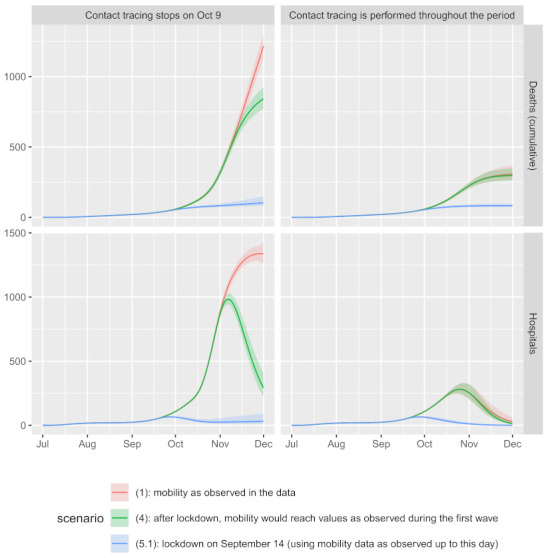
Figure 4.

Estimated number of cumulative deaths and the number of patients treated in hospitals during the second wave up to 1 December 2020 under different scenarios (see Section 2.3 for more details regarding the scenarios). Solid lines represent posterior means, shaded areas represent 90% credible intervals (CIs) (see Section 2.4 for more details).
