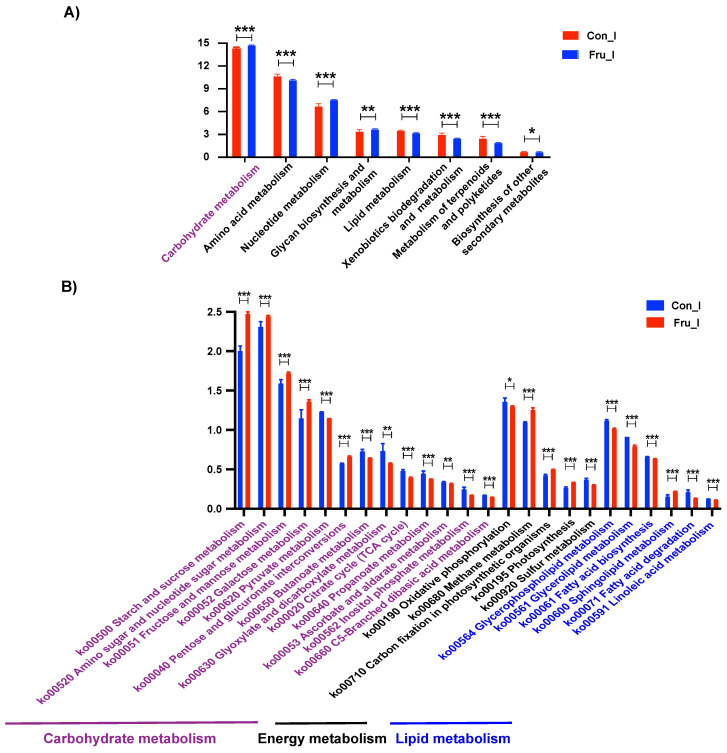
Figure 3.
Tax4Fun functional predictions of ileal microbiota. The predicted differential metabolism pathways at Pathway Level 2 (A) and the predicted differential carbohydrate, energy and lipid metabolism pathways at Pathway Level 3 (B) were shown here. Data were reported as means ± SD, n = 6. Ilea in Con group and Fru group were represented as Con_I and Fru_I respectively. *, p ≤ 0.05; **, p ≤ 0.01; ***, p ≤ 0.001.

