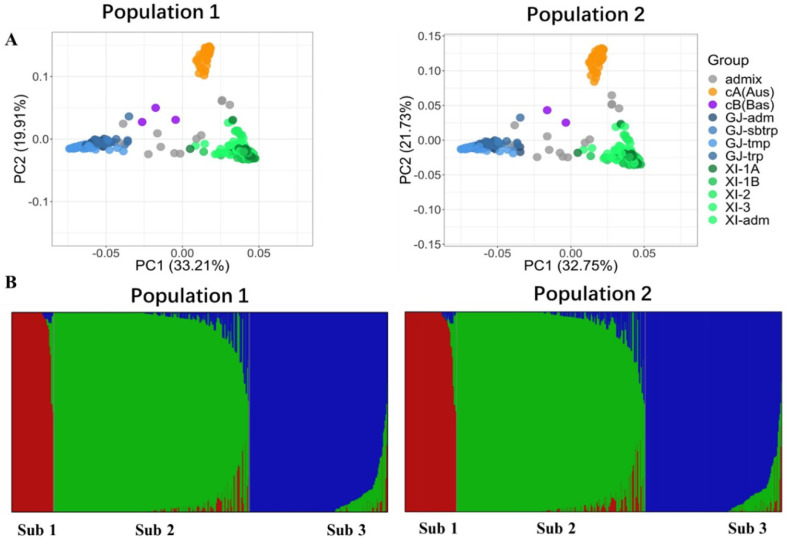
Figure 1.
Structures of the two populations. (A) Population structure revealed by the plot of first two principal components. XI, indica; GJ, japonica; Aus, aus; Bas, basmati; and admix, admixed type. (B) Population structure is estimated by the program fastSTRUCTURE. The different colors represent subpopulations. Each vertical segment represents an accession, of which the colors indicate the degree of membership of the accession in different subpopulations.

