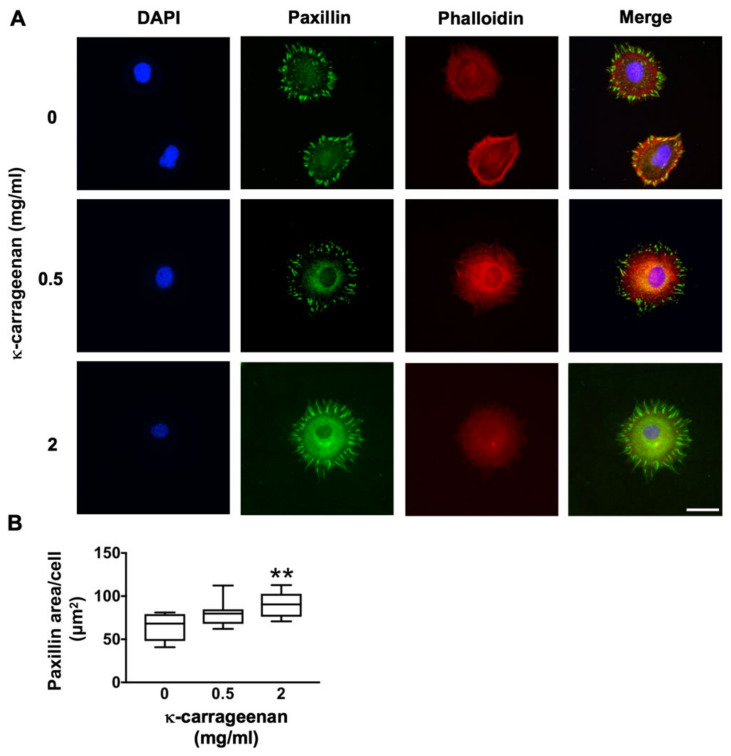
Figure 3.
Effect of κ-carrageenan on paxillin expression and distribution in MC3T3-E1 pre-osteoblasts at 2 h. (A) Cells stained for DAPI/phalloidin (blue/red) and paxillin (green). Bar: 50 µm. (B) Quantification of paxillin area in untreated control and κ-carrageenan-treated cells. Significant effect of κ-carrageenan, ** p < 0.01.

