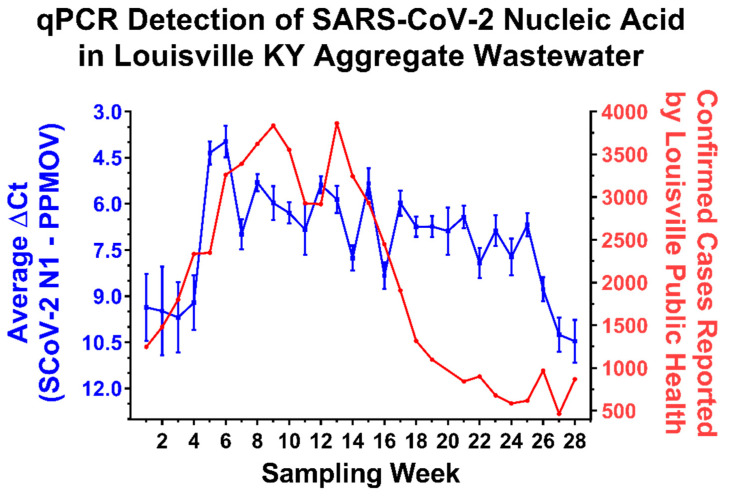
Figure 1.
The Quantitative Detection of SARS-CoV-2 in the Aggregated Wastewater of Water Quality Treatement Plants, Louisville, Kentucky. On the left Y-axis (Blue) are the averaged ΔCt values obtained from the 5 water quality treatment centers (WQTCs) that service the Louisville metropolitan area. Metadata regarding the selection of the WQTCs and the populations they serve may be found in a companion publication Yeager et al., 2021 [29]. The ΔCt values represent the levels of SARS-CoV-2 N1 amplicon normalized to the PPMOV control amplicon. Note that the left Y-axis is plotted in an inverse manner. Individual data points represent the means of three technical replicates per WQTC per timepoint, with the error bars representing the standard deviation of the means. Plotted on the right Y-axis (Red) are the numbers of confirmed SARS-CoV-2 cases reported to the city of Louisville public health authorities (as per publically available health data) on a per week basis. The X-axis represents the particular week to which the data belongs, with week 1 pertaining to the first week of October 2020, and week 28 being the last week of April 2021. The week pertaining to that of the 3rd and 4th weeks of December are omitted from the above data set, as the underlying public health and wastewater data sets were incomplete for that period of time due to the holiday season. The relevant public health data may be found in the supplemental data files accompanying this manuscript.

