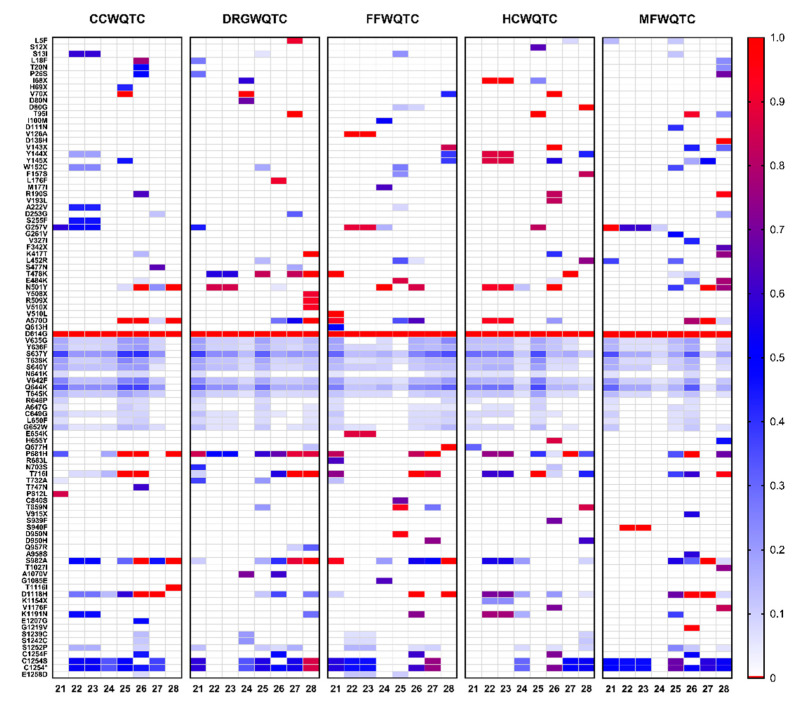
Figure 6.
S Protein Polymorphisms Detected in Aggregate Wastewater Over an 8 Week Period. Above are heatmaps for each of the individual wastewater treatment facilities that service the Louisville metropolitan area. Time in weeks is listed on the horizontal axis. Individual polymorphisms that met or exceeded the threshold of 5% prevalence are listed on the left axis. Prevalence, as determined by the number of reads associated with a given polymorphism over total is indicated above in the figure. Silent mutations are not shown.

