
Figure 2.
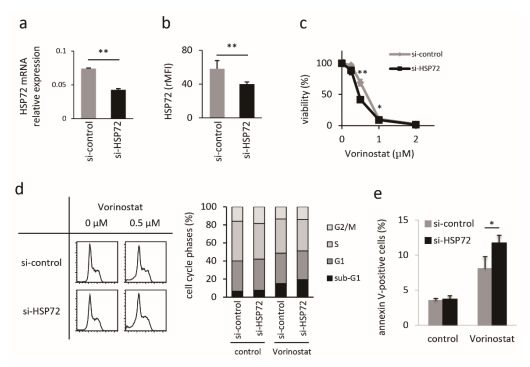
Characterization of HSP72-knockdown Hut78 cells. HSP72 mRNA expression for MOCK (gray bar) and HSP72-knockdown (black bar) Hut78 cells, normalized to GAPDH expression levels ((a), n = 2). Flow cytometric analysis of HSP72 protein expression in MOCK (gray bar) and HSP72 knockdown (black bar) cells, showing the relative mean fluorescence intensity (rMFI) + SD ((b), n = 3). Proliferation assay with vorinostat using the WST-1 assay kit ((c), n = 4). ◆: MOCK, and ■: HSP72 knockdown Hut78 cells. Assessment of the influence of HSP72 knockdown on the antitumor effects of vorinostat. Representative images are shown in the left panels, and the summary is shown in the right panel (d). Assessment of apoptosis by annexin-V assays (e). * p < 0.05, ** p < 0.01, by student t-test.