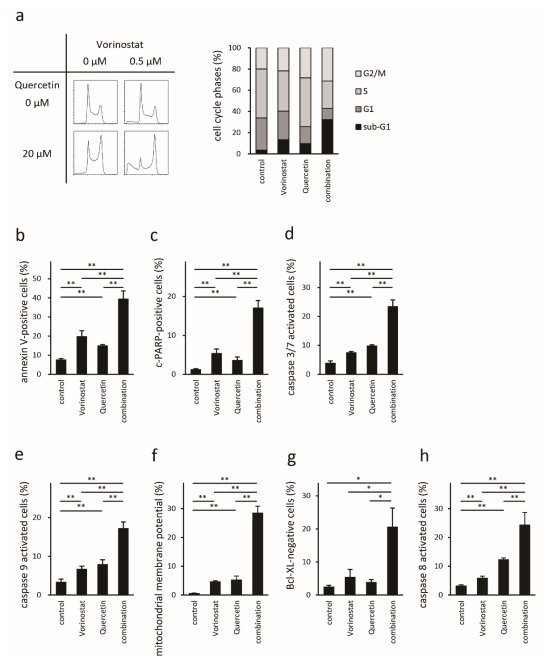
Figure 4.

Assessment of the effect of quercetin on the antitumor effects of vorinostat in Hut78 cells. Propidium iodide staining (a). Representative images are shown in the left panels and the summary of the analysis is shown as a bar graph in the right panel. Annexin V assay (b); cleaved PARP assay (c); activated caspase-3/7 (d), caspase-9 (e), and caspase-8 (h) analysis; loss of mitochondrial membrane potential (f); bcl-XL expression (g) as assessed via FACS. * p < 0.05, ** p < 0.01 by Bonferroni t-test.
