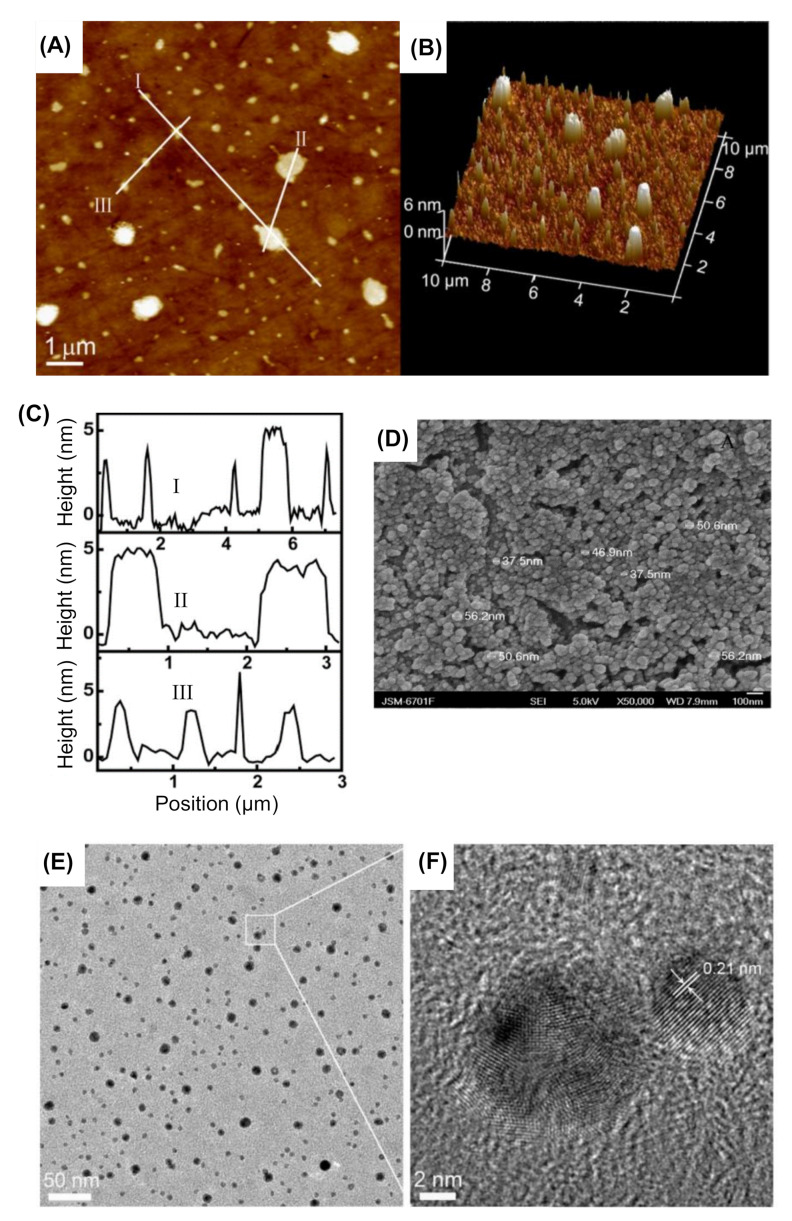
Figure 4.
Illustrations of various microscopic images for the characterization of CDs. (A) 2D topographical AFM image. Reproduced from [156], with permission from Elsevier, 2014. (B) 3D topographical AFM image. Reproduced from [156], with permission from Elsevier, 2014. (C) The height profiles of lines I, II, and III that are mentioned in (A). Reproduced from [156], with permission from Elsevier, 2014. (D) SEM image. Reproduced from [157], with permission from Elsevier, 2014. (E) TEM image [158]. (F) HRTEM image [158].

