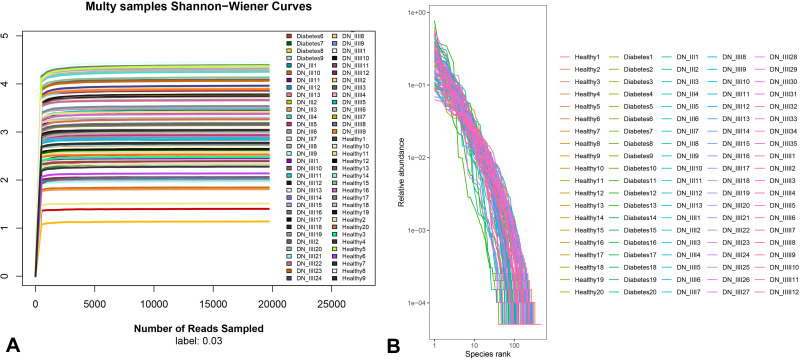
Figure 2.
Alpha diversity analysis. (A) Shannon-Wiener curves. Shannon-Wiener is an index that reflects the microbial diversity in the group. It reflected the microbial diversity of each sample at different sequencing amounts. When the curve tends to be flat, it indicates that the amount of sequencing data is large enough to reflect most of the microbial information in the group. (B) Rank-abundance curves. The Rank-abundance curve can be used to explain two aspects of diversity, namely species abundance and species evenness.

