Figure 4.
Continued.
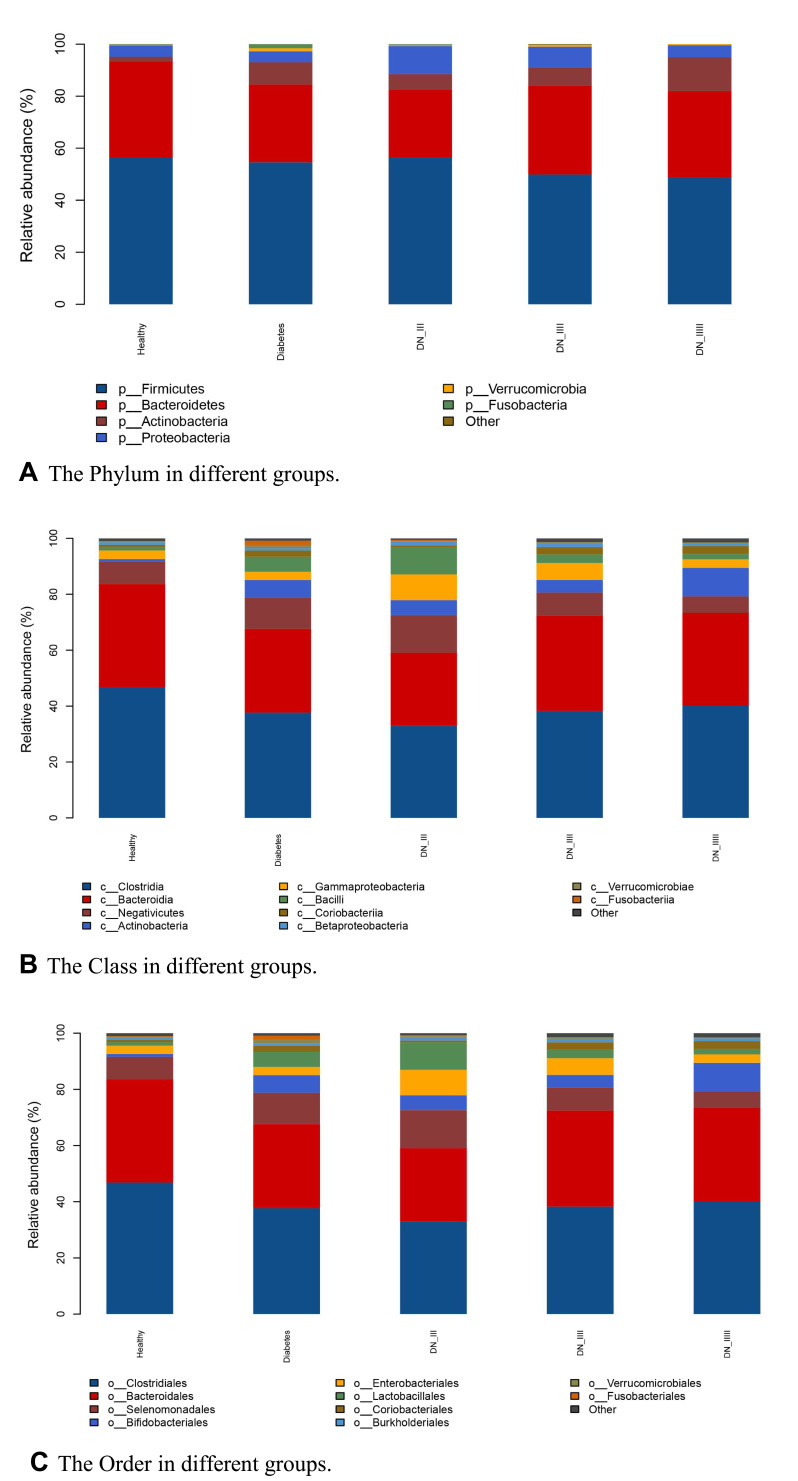
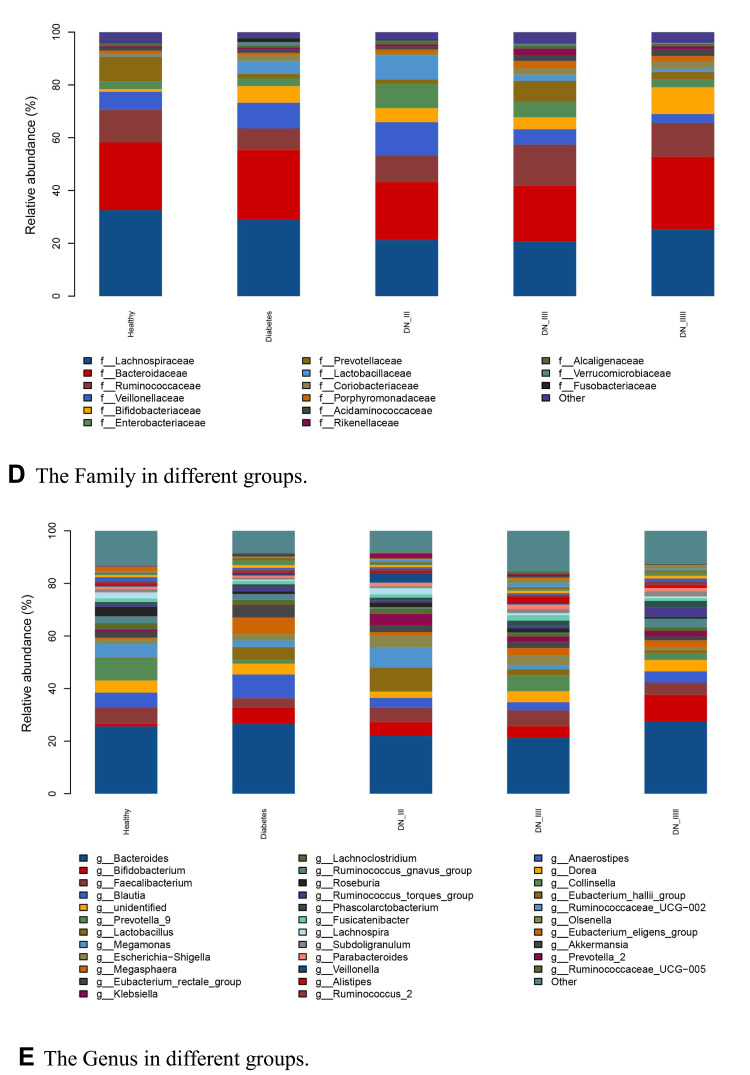
Figure 4.
Taxonomic analyses in different groups. (A) The phyla in different groups. (B) The classes in different groups. (C) The orders in different groups. (D) The families in different groups. (E) The genera in different groups. The taxonomic comparison of different groups at each classification level were revealed. The information of taxonomic analyses included kinds of microorganisms in the group and the relative abundance of each microorganism. Here we use a histogram to visualize the species composition of different groups.


