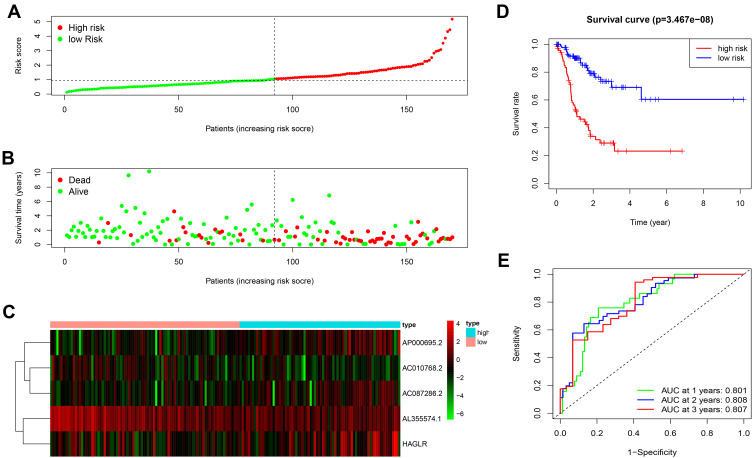
Figure 3.
The prognostic value of the 5 autophagy-related lncRNAs signature in the train set. (A) The number of patients in the high-risk and low-risk groups ranked by the risk score. (B) The scatter dot plot of GC patients’ survival status. (C) The heatmap of the 5 autophagy-related lncRNAs expression. (D) Kaplan-Meier survival analysis for patients between the high-risk and low-risk groups. (E) The ROC for the autophagy-related lncRNAs signature.

