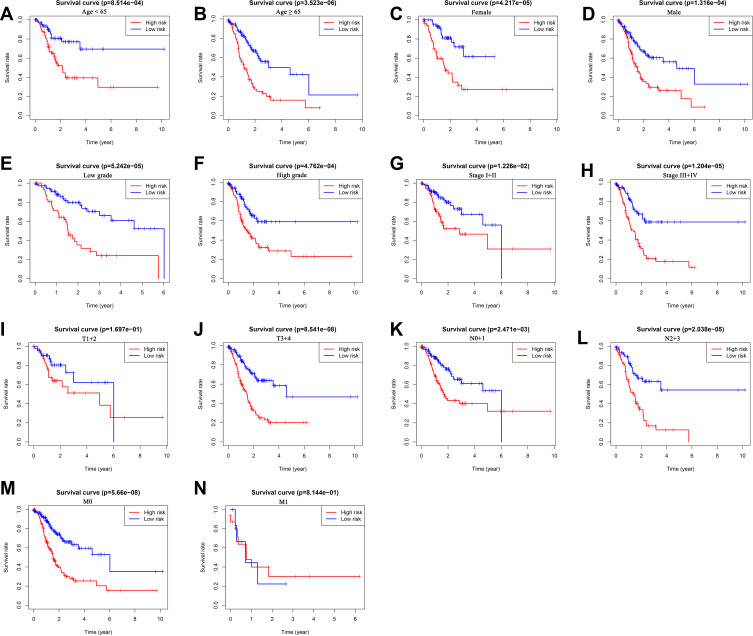
Figure 7.
The survival differences between high- and low-risk GC patients stratified by clinicopathological characteristics. (A–N) The difference in overall survival stratified by age (< 65 and ≥ 65), gender (female and male), grade (low grade and high grade), tumor stage (stage I+II and stage III+IV), T stage (T1+2 and T3+4), N stage (N0+1 and N2+3), M stage (M0, M1) between two groups.

