
Figure 1.
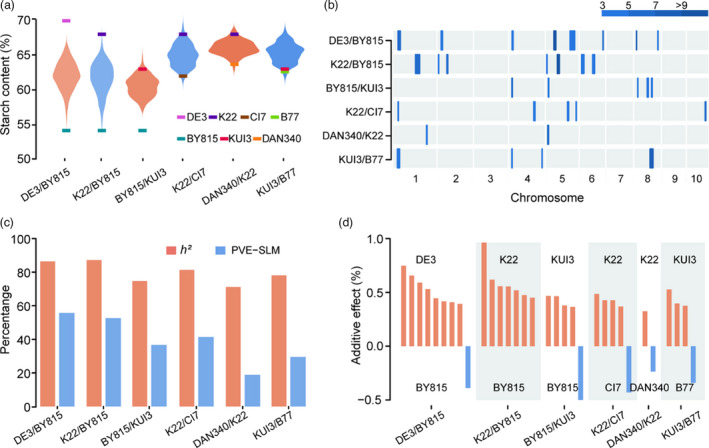
Phenotypic variation in starch content and summary of single QTLs for starch content identified by SLM analysis in six RIL populations. (a) Phenotypic variation in starch content among the six RIL populations. The short, horizontal bars of different colours indicate the starch content values for the seven parental lines. (b) Distribution of single QTLs on chromosomes. QTL regions across the maize genome are represented by confidence intervals, and LOD values are scaled by colour. (c) Broad‐sense heritability (h 2) and total PVE for single QTLs for starch content in each population. (d) Effect size and the origin of the increasing alleles of the identified single QTLs. Orange and blue bars indicate that increasing alleles come from the parents with high and low starch content, respectively, in a given population.