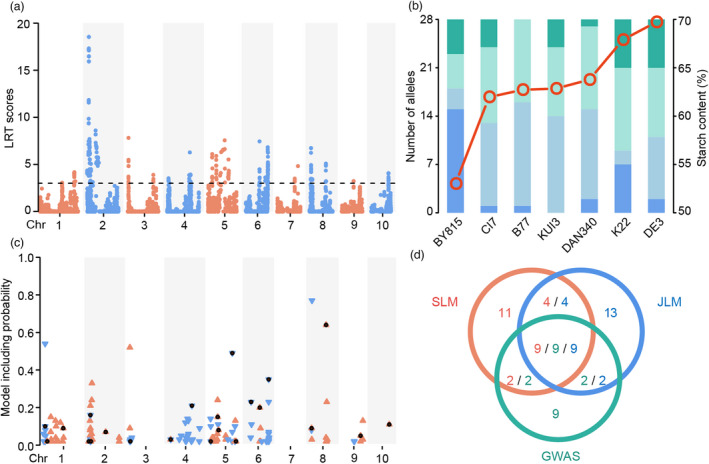
Figure 2.

Overview of QTLs for starch content identified by JLM and GWAS methods. (a) Manhattan plot resulting from the JLM results for starch content in maize kernels. The horizontal dashed line shows the threshold of the likelihood ratio test (LRT = 2.99). (b) Distribution of allelic effects on starch content from seven founders at the QTLs identified by JLM. The columns show the number of alleles from the seven founders ordered according to the values of starch content. The red circles represent the starch content of each parent. The dark green and blue shadings show the number of alleles from a founder with the largest positive and negative effects at a given locus, respectively, whereas the light green and blue shadings show the number of alleles from a founder with moderate positive and negative effects, respectively. (c) Chromosome distribution of significant SNPs via GWAS. The orange upward‐facing triangles indicate that the major allele increased starch content relative to the minor allele, the blue downward‐facing triangles indicate the opposite effect, and the black dots indicate the candidate SNPs identified by the backward regression model. (d) Venn diagram of co‐localization between QTLs detected by the three models. Orange, blue and green numbers represent the number of QTLs detected by SLM, JLM and GWAS, respectively.
