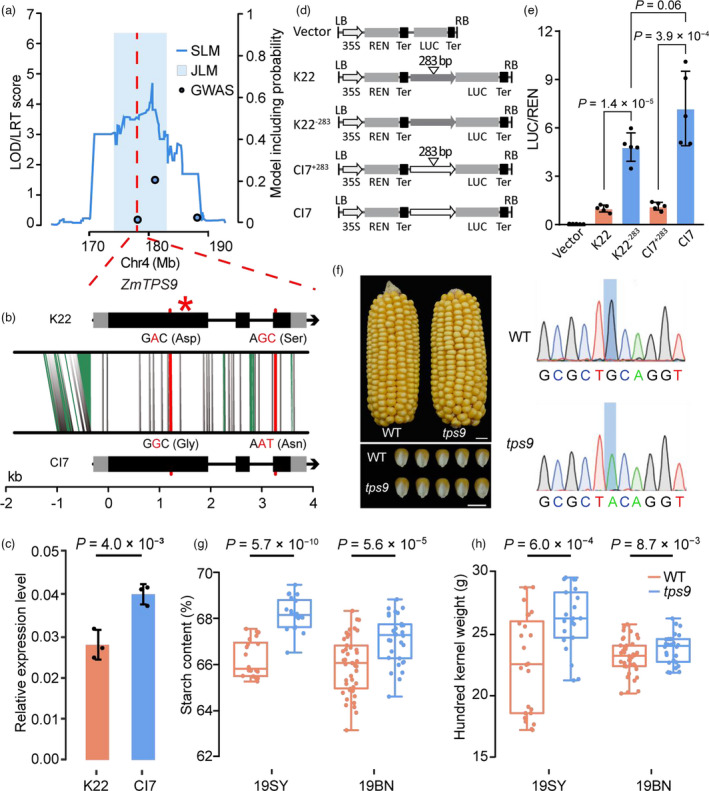
Figure 4.

ZmTPS9 affected starch content and kernel weight. (a) LOD profile of qSTA4−2 in the K22/CI7 RIL population, JLM and RIL‐GWAS results at this locus. The red dashed lines indicate the position of ZmTPS9. The blue shading depicts the support interval from JLM with its height indicating the LRT score. (b) Gene structure of ZmTPS9 and sequence comparisons between K22 and CI7. Black and grey boxes represent exons and UTRs, respectively. The grey vertical lines show SNPs in non‐coding regions and synonymous SNPs in exons; the green segments show InDels; the red lines show nonsynonymous SNPs in exons. The red star indicates the mutation position of tps9. The red nucleotides indicate nonsynonymous SNPs between K22 and CI7. (c) Expression pattern of ZmTPS9 in developing kernels at 20 DAP. (d) Constructs used to test the effect of InDel283 on ZmTPS9 expression in transient expression assays in maize leaf protoplasts. K22, K22−283, CI7 and CI7+283 constructs harbour the promoter and 5’UTR of different ZmTPS9 alleles, including 1290 bp from K22, 1007 bp from K22 without a 283‐bp insertion, 1019 bp from CI7 and 1302 bp from CI7 with a 283‐bp insertion. (e) The alleles without a 283‐bp insertion are associated with increased LUC activity in comparison with the alleles with a 283‐bp insertion. The data were normalized with respect to the average values of the K22 construct. (f) Ear and kernel morphologies and genotype of wild type (WT) and tps9. Scale bars: 1 cm. The blue shading indicates the mutated nucleotide. (g–h) Quantification of starch content and hundred kernel weight between WT and tps9. 19SY: Sanya in 2019; 19BN: Bayan Nur in 2019. In c, e, g and h, the P‐values were based on a two‐tailed Student’s t‐test.
