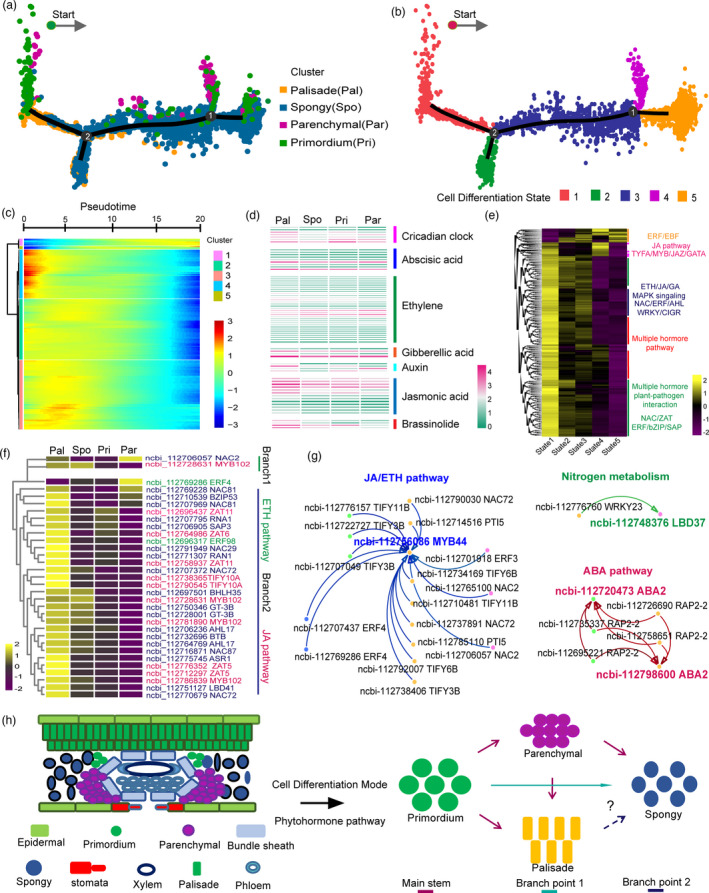
Figure 4.

Developmental trajectory of the mesophyll layer from the primordium. (a‐b) Cell cluster and differentiation state distributions followed the pseudo‐time trajectory of mesophyll development. (c) Clustering and expression kinetics of representative TFs along a pseudo‐time progression of differentiation from the primordium to the mesophyll layer. (d) Heatmap visualization of the expression level of representative TFs involved in circadian clock and plant hormone pathways. (e) Average expression heatmap of identified differentially expressed TFs associated with five cell differentiation states. (f) Representative TFs involved in branch 1‐2 differentiation. (g) A constructed critical TF interaction network involved in the process of mesophyll differentiation. (h) Putative mode of progression of primordium differentiation into mesophyll in the peanut leaf, based on trajectory analysis.
