Figure 4.

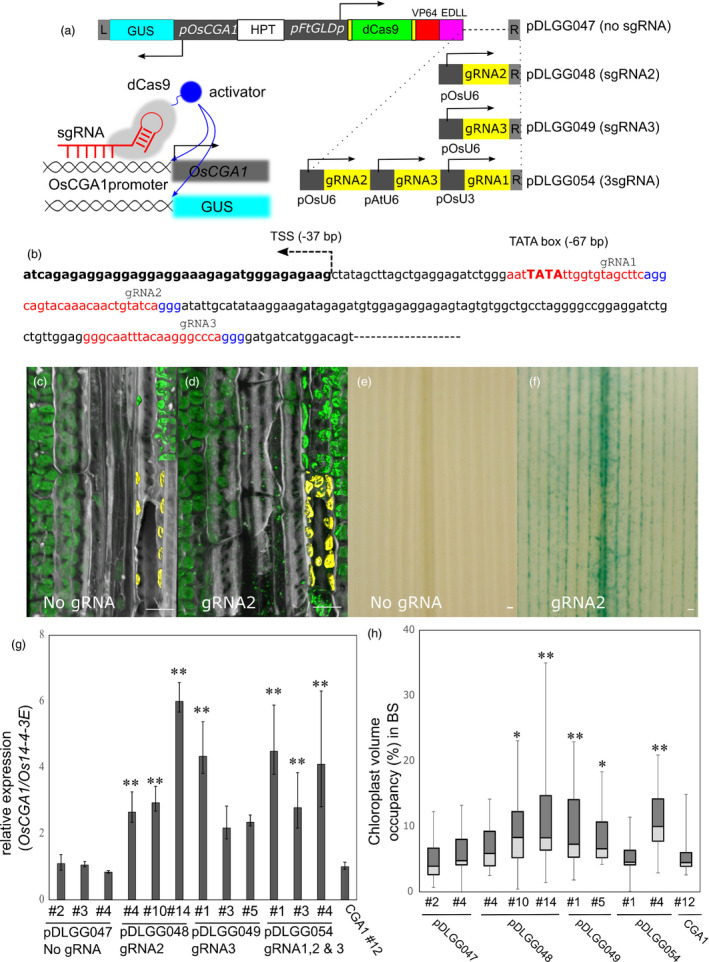
Tissue specific activation of OsCGA1 by dCas9‐AD constructs. (a) Schematic of dCas9‐mediated transcriptional activation. All dCas9 activation constructs have similar structures with the exception of gRNA sequences and number of gRNA expression modules to recruit dCas9‐ADs to the upstream region of both the endogenous OsCGA1 gene and OsCGA1promoter‐GUS reporters. The 2.1 kb upstream region of OsCGA1 was fused to the GUS gene as a proxy to monitor the tissue specificity of gene activation conferred by the FtGLDp promoter driven dCas9‐VP64‐EDLL. The pDLGG047 construct contains only the dCas9‐VP64‐EDLL cassette without a gRNA expression module and pDLGG048, pDLGG049 have a single gRNA module driven by the OsU6snRNApolymerase promoter. pDLGG054 contains three gRNAs expression modules driven by different snRNApolymerase promoters (detailed in Table S3). Left inset figure showing the schematic of dCas9‐mediated activation for both the endogenous OsCGA1 gene and the pOsCGA1::GUS reporters. HPT, hygromycin resistance cassette. Arrows indicate the direction of transcription. (b) gRNAs designed to the proximal region of the transcriptional start site of OsCGA1. gRNA binding regions and PAM sites are highlighted as red and blue, respectively. TSS, transcriptional start site. (c and d) 3D‐reconstructed confocal images of longitudinal leaf section in the BS of dCas9 activation lines, (c) dCas9‐ADs only transgenic (pDLGG047 #4) and (d) transgenic with gRNA2 (pDLGG048 #1). Chlorophyll autofluorescence and cell wall staining by calcofluor‐white are pseudo‐coloured as green and grey, respectively. Chloroplasts within a BS cell are rendered for volume quantification and highlighted as yellow pseudo colour. Scale bar, 10 μm. (e–f) GUS reporter activation by dCas9‐mediated transactivation, (e) dCas9‐ADs only transgenic (pDLGG047 #4) and (f) transgenic with gRNA2 (pDLGG48 #14). Scale bar, 10 μm. (g) Transcript accumulation difference of OsCGA1 by gRNA position. 2 cm long‐mid regions from the emerging (5th) leaf were harvested for RT‐qPCR. Three independent events from each construct are assessed for OsCGA1 expression. Each bar refers to the mean +SD and −SEM of indicated events (2 ~ 4 T1 siblings, three PCR replicates). The letters above the bars note significant differences (**P < 0.01 as analysed using one‐way ANOVA followed by a Tukey’s post hoc test) compared to the expression level of pDLGG047 (no gRNA) control lines. (h) Box plot of chloroplast volume occupancy in the BS of various OsCGA1‐dCas9 activation events. The letters above the bars denote significant differences (**P < 0.01, *P < 0.05 as analysed using one‐way ANOVA followed by a Tukey’s post hoc test) compared to the chloroplast volumes of pDLGG047 (no gRNA) control lines.
