
Figure 1.
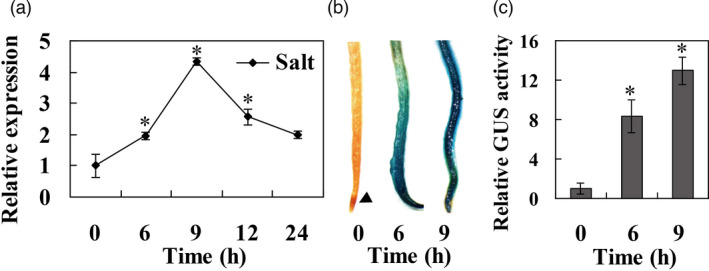
Expression profiles of PagWOX11/12a under salt stress. (a) RT‐qPCR analysis of PagWOX11/12a expression in total roots of non‐transgenic 84K poplar under salt stress. Four‐week‐old non‐transgenic 84K poplar plants were subjected to 200 mm NaCl for the indicated times. The root tissues were collected from 10 individuals and used for RT‐qPCR analysis. The bars represent means ± SD (n = 4). (b, c) Histological staining and GUS activity of the root tips of ProPagWOX11/12a::GUS transgenic poplar plants under salt stress. Four‐week‐old transgenic poplar plants were subjected to 200 mm NaCl for the indicated times. At least 20 roots were harvested from three biological replicates (more than 10 individuals each) for GUS staining and activity analysis. The values of GUS activity under control growth conditions were normalized to 1. The experiments were performed three times and the similar results were obtained. The bars represent means ± SD (n = 6) and the asterisks indicate significant differences with respect to the values for 0 h (*P < 0.05).